What Is SDE and How Does It Shape a Business Sale
What Is SDE. Learn what SDE means in business valuation, how to calculate it with common add-backs, how it differs from EBITDA, and why buyers and lenders focus
October 7, 2026
By Remi Taffin · August 22, 2026

You’ve run a successful HVAC, plumbing, electrical, or specialty service company for years. Then a broker or valuation specialist gives you a number based on “comps,” and you’re expected to trust it. You can see your own revenue, earnings, trucks, equipment, contracts, and customer relationships. What you can’t immediately see is how someone turned another company’s market price into your value.
That gap matters. Comparable company analysis is a market-based valuation method used widely in investment banking and corporate finance, but it isn’t a magic calculator. It’s a judgment exercise built on peer selection, financial normalization, and the choice of a valuation multiple. If the comparisons are weak, the conclusion can be weak even when the spreadsheet looks polished.
An owner usually meets comparable company analysis at an uncomfortable moment. The business is profitable, the owner is tired of carrying every decision, and a broker presents an estimated value before a sale process begins. The owner asks a fair question: “Why is my company worth that amount?” The answer is often a peer group, a multiple, and a market reference that feels distant from the day-to-day business.
That doesn’t make the method useless. Buyers use market comparisons to support offers, lenders use valuation evidence when assessing acquisition financing, and advisors use comparable companies to test whether a proposed price sits within a defensible range. A 2023 review of M&A advisor behavior found comparable trading firms were used in 66% of the full sample, while past-period multiples appeared in 42% of cases, current-period multiples in 33%, and forward multiples in 25%, as reported in this Wiley excerpt on M&A valuation practice. The figures show how trading comparables influence deal pricing, while also showing that professionals mix historical and forward-looking information.
A comps-based value isn’t a promise that your company will sell at a particular price. It’s an estimate based on how the market has priced businesses considered similar. That distinction becomes important for owner-operated companies because public peers often have different management structures, financing, reporting quality, geographic reach, and customer concentration.
You should treat the analysis as a starting point for a valuation conversation, not as an unquestionable verdict. Ask which companies were selected, which financial period was used, whether owner compensation was normalized, and whether the result represents enterprise value or equity value.
Practical rule: Never debate the final number before you understand the peer group and the earnings measure underneath it.
Comparable company analysis also sits beside other approaches. A discounted cash flow model focuses on your company’s expected cash generation. Precedent transactions examine prices paid in completed deals. Comps provide a market reality check based on how similar companies are priced. A specialist may use all three, but you should know which method is driving the conclusion and why it deserves the most weight.
Think about pricing a house. A buyer may look at homes with similar size, location, condition, and features, then compare the sale price per square foot. The comparison doesn’t say every room is identical. It creates a market reference that helps the buyer judge whether the asking price makes sense.
Comparable company analysis uses the same basic logic. Instead of price per square foot, analysts compare value relative to a business measure. The numerator is usually enterprise value or equity value. The denominator may be EBITDA, EBIT, revenue, net income, or earnings per share. This Wall Street Prep guide to comparable company analysis describes the method as a numerators-over-denominators framework and explains why the denominator must match the economics of the company being valued.
Identify the numerator. Enterprise value reflects the value of the operating business before considering how it’s financed. Equity value is the value attributable to owners after relevant debt and other claims are considered.
Identify the denominator. EBITDA can be useful when comparing operating performance across different capital structures. EBIT includes depreciation and may be more informative when equipment investment matters. Revenue can be relevant where margins vary or profitability is still developing. Net income and EPS incorporate interest and taxes, so they’re more sensitive to financing and tax decisions.
Check the period. Analysts commonly standardize comparisons using last-twelve-months, or LTM, and next-twelve-months, or NTM, results, particularly when peer companies have different fiscal year-ends. LTM reflects recent performance. NTM introduces expectations about the coming period.
Apply a representative multiple. A median or mean multiple is applied to the target company’s corresponding financial measure. The result is an indication, not a final answer, because the target may deserve a position above or below the peer group based on growth, risk, margins, or owner dependence.
The multiple itself isn’t a quality score. It’s a market ratio. A higher ratio may reflect stronger growth or more predictable earnings, while a lower ratio may reflect customer concentration, weak margins, heavy equipment needs, or dependence on one owner. The useful question is never “What multiple can I get?” It’s “Which multiple captures the economics and risks of my business?”
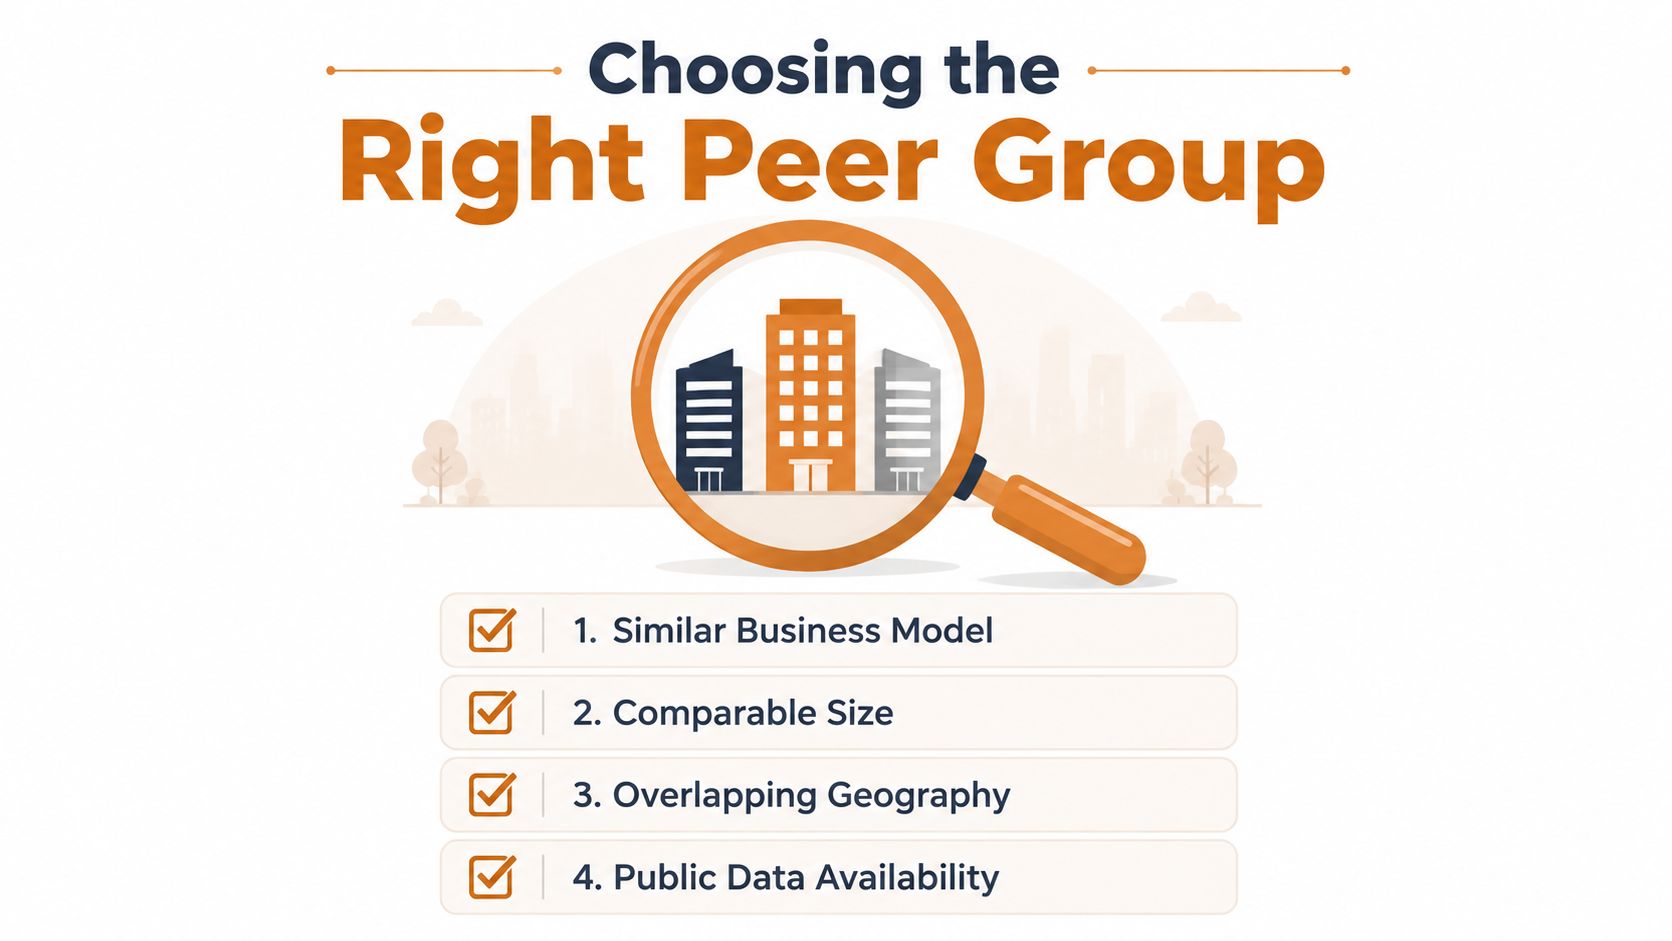
The peer group is where most of the judgment sits. A specialist can select a clean median, format a professional table, and still produce a poor valuation if the companies don’t resemble yours in the ways that affect buyer decisions.
A trades business shouldn’t be compared solely because it shares an industry code with another company. A residential HVAC contractor with maintenance agreements, strong dispatch systems, and diversified technicians may have a different risk profile from an installation-heavy contractor dependent on construction cycles. A plumbing company serving one metro area may not be comparable to a national consolidator with centralized purchasing and professional management.
A useful peer group should be examined across several dimensions:
Academic research supports this emphasis on fit. A CBS study on peer selection in multiples valuation concluded that including about 10 peers produced the most accurate valuation in its analysis. The practical lesson isn’t to force every valuation into a fixed peer count. It’s to recognize that a small, carefully matched group can outperform a broad industry basket filled with weak comparisons.
When a specialist presents the peer group, ask for a reason beside every company. “Same industry” isn’t enough. You want to know why the company matches your size, service mix, market, revenue quality, and operating risk.
Then ask what happens if the strongest or weakest peer is removed. If the conclusion changes dramatically, the valuation is sensitive to peer selection and should be presented as a range with a clear explanation. You should also ask whether the analysis uses public companies, completed transactions, or both. Those references can reflect different ownership and control conditions.
The best peer group isn’t the largest one. It’s the one that makes the comparison easiest to defend.
A credible analysis acknowledges imperfect matches instead of hiding them. If no public company resembles your local service business closely, the specialist should explain the limitations and use other valuation methods as a cross-check rather than presenting a market multiple as precise.
The right multiple depends on what the denominator says about the business. Enterprise value divided by EBITDA, or EV/EBITDA, focuses on operating earnings before interest, taxes, depreciation, and amortization. It can help compare companies with different financing choices, but it may need careful interpretation for businesses with meaningful equipment replacement requirements.
EV/revenue can be useful where revenue is easier to compare than earnings, particularly when margins are temporarily compressed or the business is investing in growth. It becomes dangerous when used without a serious look at gross margin, labor efficiency, customer acquisition costs, and normalized profitability. Two companies can generate similar revenue while producing very different cash outcomes.
Price-to-earnings, or P/E, uses equity value divided by net income or earnings per share. It can fit a stable company with predictable tax and financing conditions, but it’s more affected by debt, interest expense, tax structure, and owner-specific decisions.
LTM figures show what the company has recently produced. They’re usually the cleanest starting point when the business has stable operations and reliable financial records. NTM figures look ahead, so they can capture signed contracts, price increases, capacity additions, or expected normalization, but they also introduce forecast risk.
For an HVAC company coming off an unusual weather year, LTM may overstate or understate ordinary earnings. For a service business that has recently built a credible maintenance base, NTM may better reflect the next operating period, provided the forecast has evidence behind it. Don’t accept a forward multiple because it produces a more attractive value.
This plain-language guide to how businesses are valued using multiples can help you review the basic logic before meeting a specialist.
| Business Profile | Primary Multiple | Why It Fits | Typical Range |
|---|---|---|---|
| Equipment-intensive trade business | EV/EBITDA or EV/EBIT | Connects value to operating earnings while recognizing the importance of equipment and depreciation | Not stated |
| Growing service company with uneven margins | EV/revenue, cross-checked against normalized earnings | Revenue may show market scale, but profitability still determines economic value | Not stated |
| Stable, mature service company | EV/EBITDA or P/E | Predictable earnings can support a direct earnings-based comparison | Not stated |
| Highly owner-dependent company | Normalized earnings multiple | Adjusted earnings better reflect the cost of replacing owner functions | Not stated |
The multiple should follow the business economics, not the other way around. Ask which denominator was chosen, why it fits, and how the conclusion changes under LTM and NTM assumptions.
Consider a hypothetical HVAC and plumbing company with residential service, replacement work, and recurring maintenance agreements. The owner wants a preliminary value before deciding whether to sell, recapitalize, or begin succession planning.
A specialist might search for a small group of public or recently acquired companies with overlapping service characteristics. The available peers won’t be perfect. Public companies may have greater scale and professional management, while transaction data may reflect control premiums or private-company adjustments. The analyst’s job is to explain those differences rather than pretend they don’t exist.
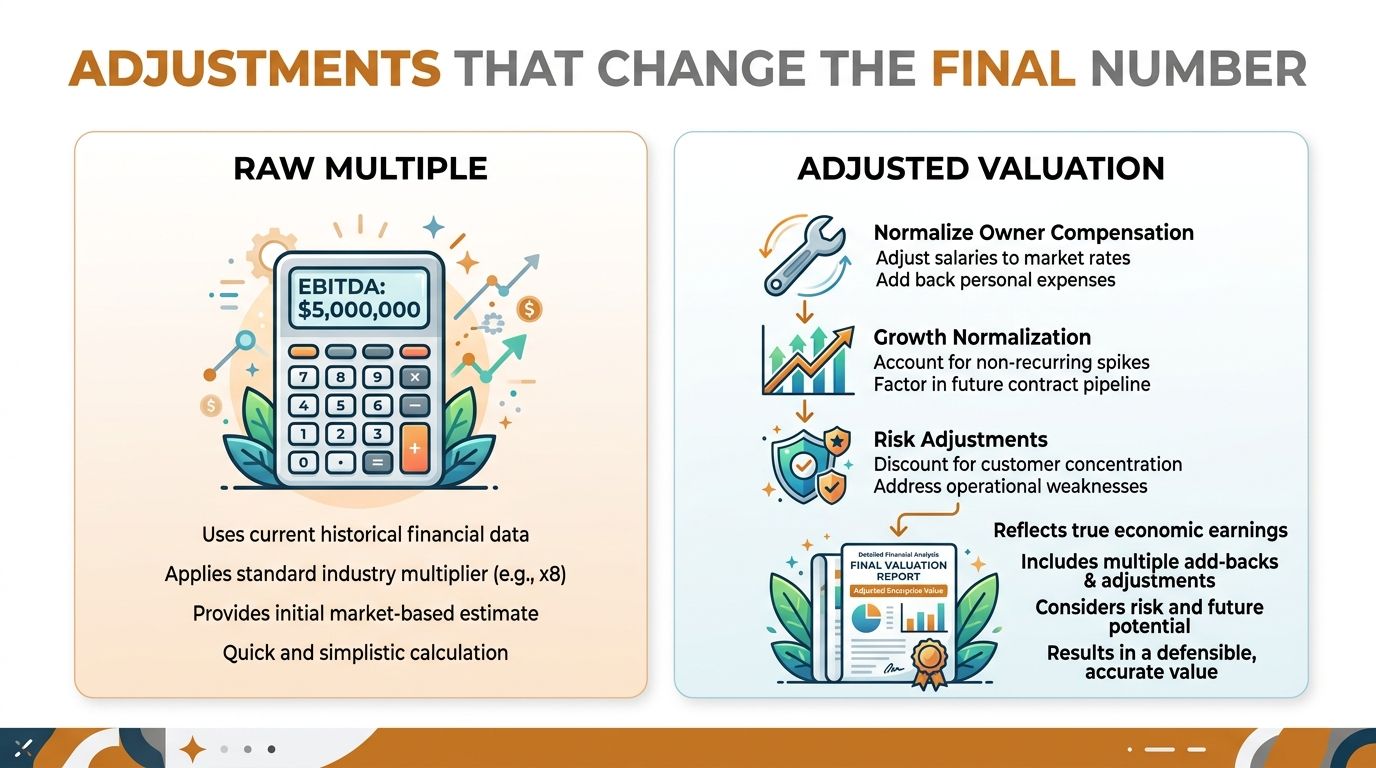
Assume the company’s normalized EBITDA is $1.2 million. That figure isn’t automatically the number shown on the tax return. It may require adjustments for owner compensation, personal expenses, one-time repairs, or other items that won’t continue under a new owner.
Suppose the analyst identifies a peer group and calculates a range of observed EV/EBITDA multiples. To keep the example focused on mechanics, assume the selected reference points are 4.0x, 5.0x, and 6.0x. These are illustrative assumptions, not market data or a claim about typical HVAC pricing.
Applying them to normalized EBITDA produces three enterprise value indications:
The arithmetic is simple. The judgment is not. The lower indication might fit a business with concentrated customers, weak documentation, or heavy owner involvement. The upper indication might require strong recurring service revenue, reliable financial reporting, a capable management layer, and a credible growth outlook.
The example produces enterprise value, not necessarily the amount you’ll receive at closing. Debt, excess cash, non-operating assets, working capital requirements, and transaction structure can change the equity value. A buyer may also negotiate a different treatment for vehicles, real estate, inventory, or accounts receivable.
The HVAC business valuation guide offers a practical starting point for owners thinking about the industry-specific drivers behind the number. Use it to frame questions, not to replace a detailed analysis of your own financials.
A strong report will show the peer data, the selected multiple, the normalized earnings bridge, and the adjustments from enterprise value to equity value. If you only receive a final number, you haven’t received enough information to challenge the conclusion intelligently.
A raw trading multiple is only the beginning. Public-market values reflect companies that investors can buy and sell through an organized market. A private, owner-operated business has different ownership, liquidity, governance, and reporting characteristics. The analyst must translate the market reference into a value appropriate for the subject company.
The first major adjustment is earnings normalization. Owner compensation may be above or below the amount required to hire someone for the actual role. Personal expenses may run through the company. A one-time legal bill, unusual equipment failure, or nonrecurring project can distort reported earnings. The goal isn’t to make EBITDA look better. It’s to estimate the earnings a buyer can reasonably expect to continue.
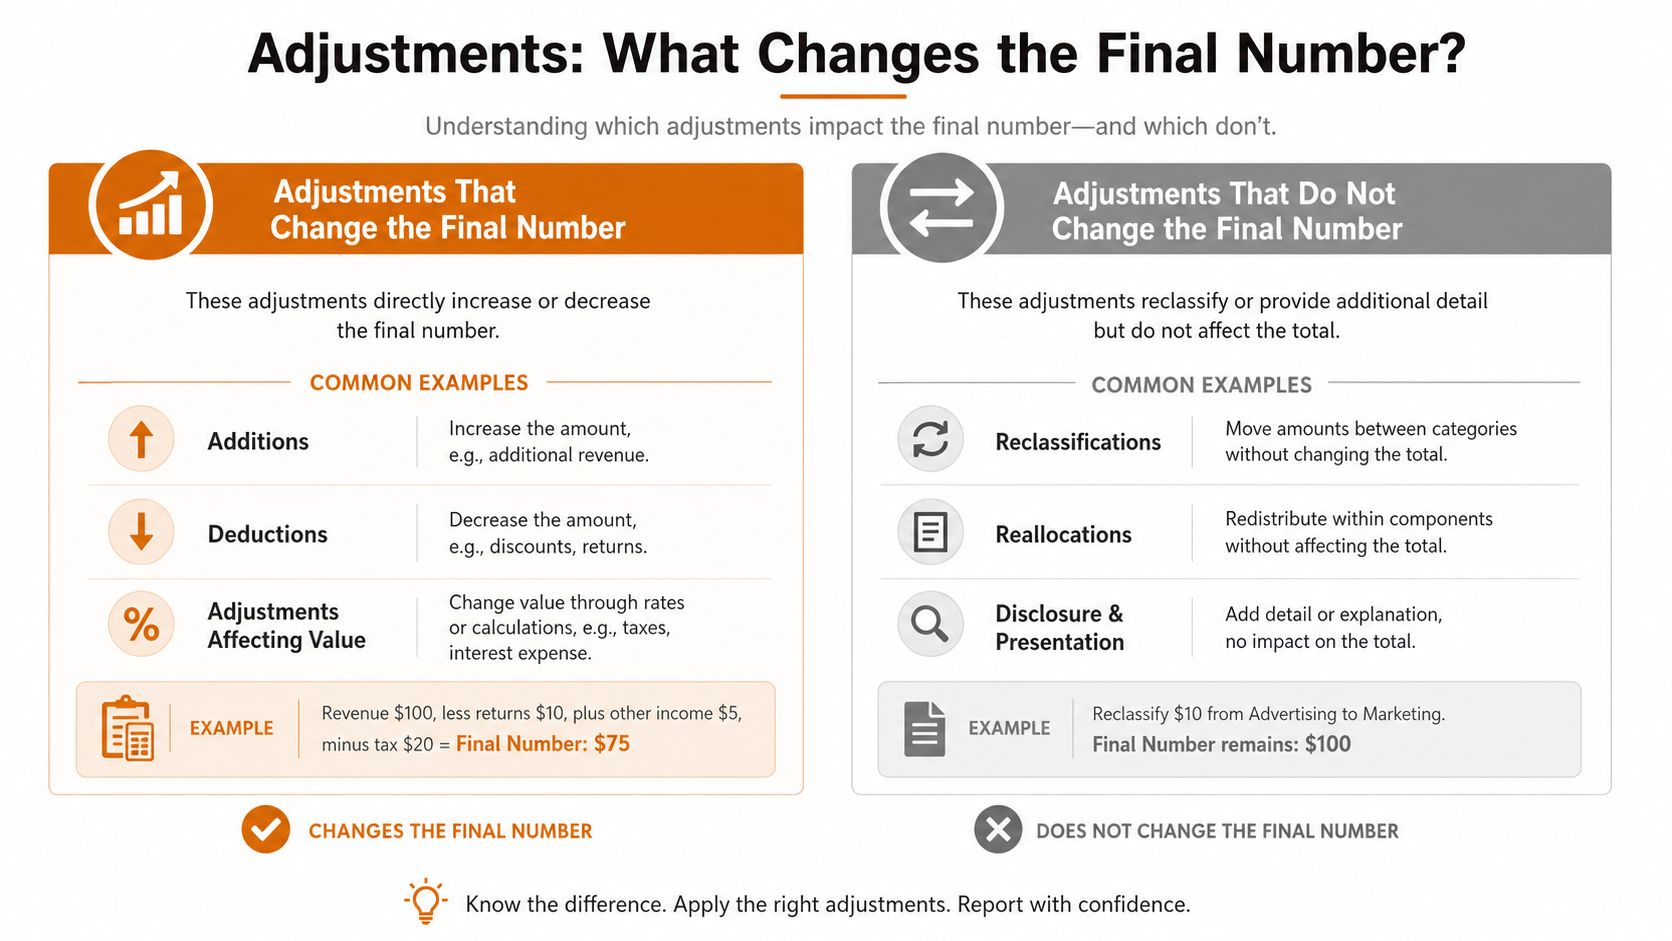
A valuation report should make clear whether the multiple applies to enterprise value or equity value. Excess cash, non-operating investments, vehicles not required by the business, owned real estate, debt, and working capital can all affect the amount attributable to the owner.
The guide to seller’s discretionary earnings is useful when reviewing smaller owner-operated companies where the owner’s personal role and compensation are closely tied to reported profit. Seller’s discretionary earnings and EBITDA aren’t interchangeable. A specialist should explain which measure is being used and why it reflects the buyer’s likely economics.
Two professionals can use the same peers and reach different values because they normalize earnings differently, assign different weights to multiples, or treat debt and excess cash differently. That doesn’t automatically mean one is careless. It means the assumptions need to be visible.
Ask these questions:
A rigorous public-company analysis includes peer screening, financial normalization, comparative tables, multiple selection, and adjustments for items such as excess cash, debt, and level of value. The NACVA guideline on public company and transaction comparisons describes that broader process. That’s the standard you should expect from a report intended to support a sale, financing decision, or ownership transition.
Owners who understand comparable company analysis before hiring a broker or valuation specialist negotiate from a stronger position. They don’t need to build a professional market database. They need to understand what is being compared, what earnings measure is being multiplied, and which assumptions could move the result.
Start by preparing your own operating file. Separate recurring service revenue from project work. Document customer concentration, technician retention, pricing changes, equipment needs, owner responsibilities, and the systems that keep the company running. Those details help a specialist select better peers and explain why your company should sit toward the stronger or weaker end of a range.
Use the analysis to improve the business, not merely to argue over a multiple. Better financial reporting, documented processes, management depth, diversified customers, and recurring contracts can make the company easier for a buyer to understand and operate. They may also support a more favorable comparison, although no improvement guarantees a particular valuation outcome.
Don’t commission a formal analysis to obtain a flattering number. Commission it when you need a defensible basis for a sale, partner buyout, family transfer, financing discussion, or succession plan. The report should help you make a decision and withstand questions from buyers, lenders, family members, and advisors.
For help evaluating valuation specialists and other transition professionals, The Owner’s Shortlist offers a curated directory and plain-language resources for owner-operated businesses, including guidance on valuation, taxes, legal planning, financing, and succession. Visit the site before your first specialist meeting, review the relevant questions, and approach the conversation with your financials and assumptions ready.
Tell us your situation. We'll connect you with a specialist who works with owners like you. One conversation, no sales pressure.
Found this useful?
Add The Owner's Shortlist as a preferred source and get our articles highlighted in Google Search results.
Add to Preferred SourcesWhat Is SDE. Learn what SDE means in business valuation, how to calculate it with common add-backs, how it differs from EBITDA, and why buyers and lenders focus
October 7, 2026
Discover what a business valuation report includes, how to interpret it, and why it matters for your company's financial strategy.
October 6, 2026
Explore the best value drivers that influence exit value, with practical steps owners can take before engaging a valuation specialist.
October 4, 2026
Confused by SDE vs EBITDA? Learn when each metric applies to your owner-operated business, how adjustments change valuations, and which buyers prefer which
October 3, 2026