Accretive vs Dilutive: EPS Test for Owners
Learn accretive vs dilutive: when EPS rises or falls, how financing flips the result, and what service-business owners should ask before a sale.
November 1, 2026
By Remi Taffin · November 9, 2026
A backlog is signed or committed work that hasn’t been completed yet, and it isn’t a sales forecast or cash in the bank. You’re likely looking at a board, spreadsheet or job list right now that’s full of names, dates and dollar amounts, and you’re wondering how much of it you can count on.
That’s the right question. A clean total can hide unsigned quotes, underpriced jobs, unpaid deposits and work your crews can’t finish on time. The number becomes useful only when you test it for quality, delivery capacity and cash timing. Once you do that, backlog stops being a feel-good figure and starts telling you what revenue is real, where you’ll get squeezed and whether a buyer would trust the same list.
If you’re asking what is a backlog in plain terms, it’s work your business has already sold or committed to but hasn’t finished yet. It grows when you sign new contracts and shrinks as crews complete the work. Nothing on that list should be there on a hope or a handshake alone.
Think about a restaurant kitchen. The order tickets clipped to the rail above the grill are the backlog, because the kitchen has accepted those orders and now owes those meals. A server’s guess about what a table might order later isn’t yet on the rail.

Your shop works the same way. A signed HVAC install, an accepted roofing quote with a start date and a purchase order for commercial plumbing all belong on the rail. An open estimate doesn’t, even if the customer sounds certain.
Pipeline covers quotes and open bids that may or may not close. If you want to get tighter about separating that earlier stage from committed work, Truespeak’s guide to pipeline management is a useful companion for tracking how leads move toward a signature.
A forecast is your estimate of future sales. Revenue is work you’ve already completed and billed or recognized. Backlog sits between a signature and finished work, and it isn’t interchangeable with any of them.
National measurement follows that same separation. The Federal Reserve Bank of Richmond manufacturing survey asks companies to report changes in shipments, new orders, order backlogs, capacity utilization and other measures separately. Its responses become diffusion indexes by subtracting the percentage reporting declines from the percentage reporting increases, so a positive reading means more firms reported growing backlogs than shrinking ones.
| Measure | What It Counts | Status |
|---|---|---|
| Backlog | Work signed or committed but not yet completed | Firm, scheduled or in progress |
| Pipeline | Quotes and open bids not yet signed | Uncertain until signed |
| Forecast | Estimated future sales | Estimate only |
| Revenue | Work already completed and billed | Earned |
Practical rule: If the customer has signed and a crew date exists, it’s backlog. If it’s still a quote, it’s pipeline.
You don’t need new software to do this well. You need one current list, a few honest subtractions and the same calculation each month so the trend means something.
This visual lays out the first moves before you work through the full list.
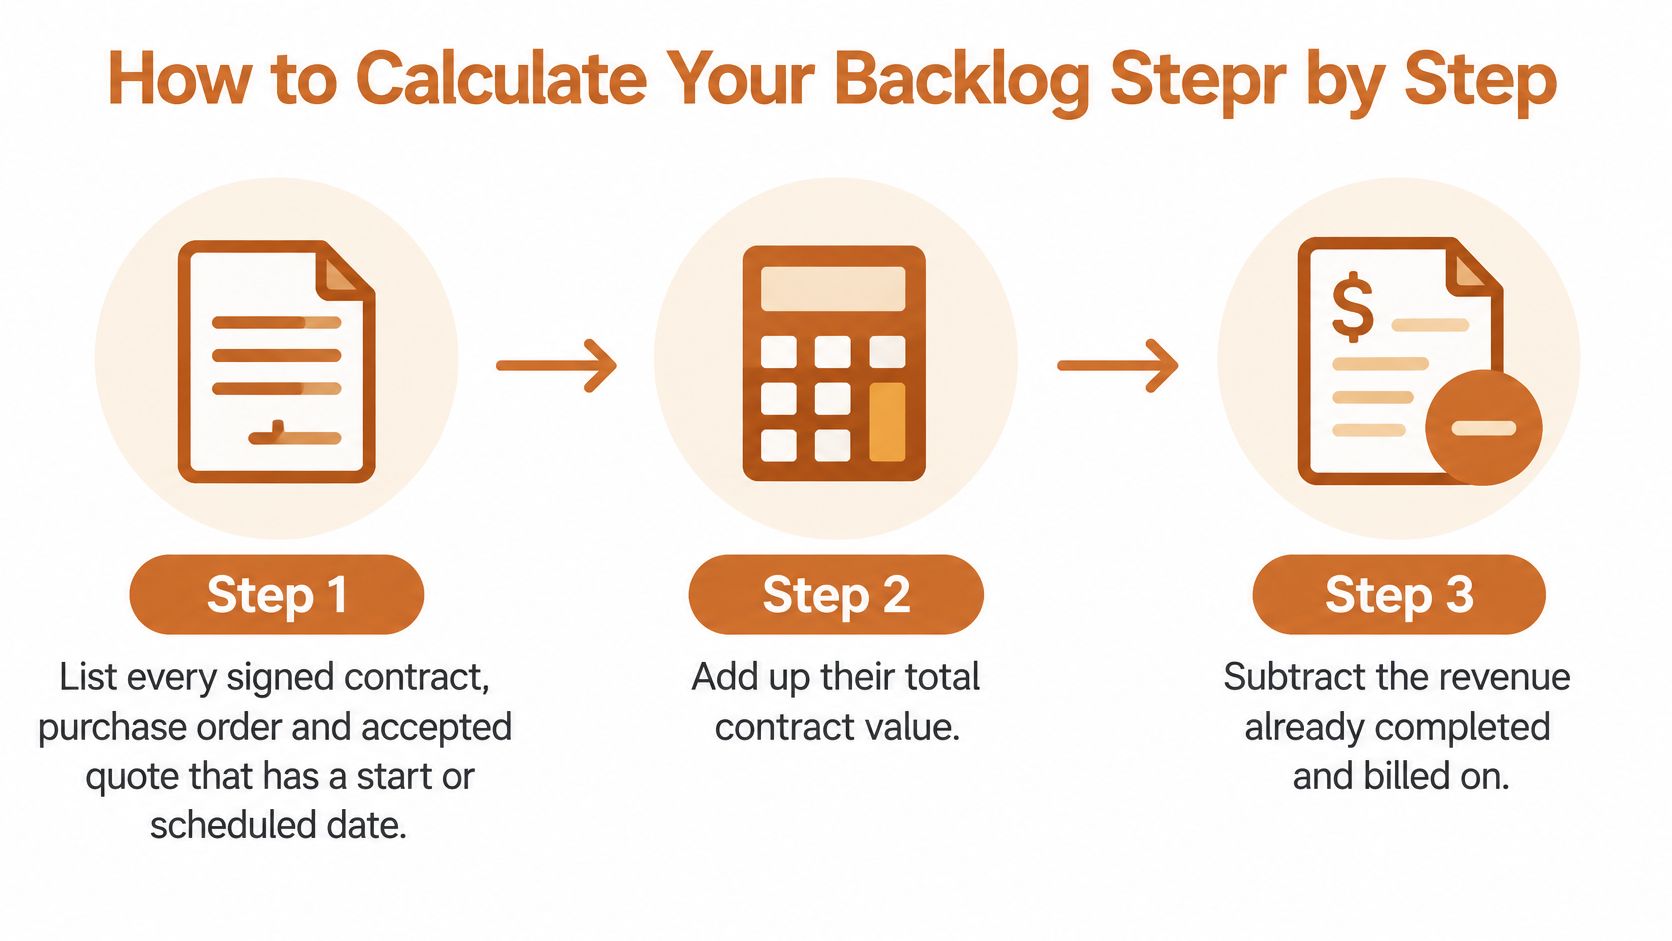
Owners who track repeat service agreements sometimes compare this with a recurring revenue view, and our page on how to calculate annual recurring revenue shows why contracted dollars and recognized revenue need separate treatment.
This short walk-through reinforces the arithmetic before you apply it to your own sheet.
Say a plumbing company in a hypothetical example has $1.2 million signed and $300,000 already completed. Its dollar backlog is $900,000. Divided by average monthly revenue of $150,000, that’s 6.0 months.
If its crews can realistically deliver $180,000 a month, capacity-adjusted backlog is 5.0 months. Same jobs, different answer, and the second answer is the one that should drive hiring and promise dates.
| Measure | Formula |
|---|---|
| Dollar backlog | Signed contract value minus revenue completed to date |
| Months of backlog | Dollar backlog divided by average monthly revenue |
| Capacity-adjusted backlog | Dollar backlog divided by realistic monthly delivery capacity |
| Funded backlog | Portion covered by deposits, progress payments or authorized change orders |
| Gross margin in backlog | Expected revenue minus direct labor and materials |
The common slips are counting unsigned quotes, forgetting partly finished jobs and dividing by annual revenue instead of monthly revenue. Avoid those and you should end with three figures you trust, one in dollars, one in months and one adjusted for capacity.
Dollars alone are hard to compare. A $900,000 backlog means very different things for a company billing $100,000 a month and one billing four times that amount. Months put both businesses on the same ruler and let you track your own company across busy and slow years.
The Associated Builders and Contractors Construction Backlog Indicator is designed to measure how many months of work commercial and industrial contractors have ahead of them. In its reported 2026 readings, the national indicator moved from 9.1 months in May to 8.8 months in June and 8.0 months in July, before rebounding to 8.5 months in August and 8.7 months in September.
Two earlier readings give useful context. The Associated Builders and Contractors September 2025 release reported a U.S. construction backlog of 8.5 months, unchanged from August and down 0.1 months from September 2024. In October 2025, the Associated Builders and Contractors October release reported that U.S. construction contractors had an average backlog of 8.4 months, based on a survey of its members.
| Reading | Months of Work | Context |
|---|---|---|
| September 2025 | 8.5 | Unchanged from August and down 0.1 months from September 2024 |
| October 2025 | 8.4 | Average reported across surveyed U.S. contractors |
| May 2026 | 9.1 | Starting point of the 2026 readings |
| June 2026 | 8.8 | Down as production outpaced new bookings |
| July 2026 | 8.0 | Lowest reading in the 2026 run |
| August 2026 | 8.5 | Rebound as new work was signed |
| September 2026 | 8.7 | Data-center contractors reported 11.3 months |
A rising reading generally reflects new signed work entering faster than projects finish. A falling reading generally reflects the opposite, whether because production outpaces bookings, projects stall or contracts get canceled.
That headline can hide big differences inside it. In the September data, the 15% of ABC members with data-center work under contract reported 11.3 months of backlog, three months more than contractors without such projects, as described in the ABC indicator material already linked above.
Compare first with your own twelve-month history, then with the national band. A gap in either direction is a question about bookings, delays or pricing, not a grade.
These national figures cover commercial and industrial contractors, so a residential plumber or similar contractor shouldn’t treat them as a target. Use them to sanity-check direction. Your own trend, job mix and crew capacity matter more.
Three beliefs get owners in trouble. A bigger backlog means more profit. Backlog equals cash. A long backlog proves the business is healthy.
Each one can be false. A headline figure can include work that isn’t firm, priced right or funded.
SEC disclosures make that distinction openly. One SEC filing excerpt on remaining performance obligations illustrates how companies distinguish firm obligations from unexercised options and potential orders, and some separate funded backlog from unfunded backlog. In plain terms, signed paper and authorized money aren’t always the same thing.
Run those tests job by job. Customer concentration, cancellation rights and change-order exposure belong on the same review, because a buyer will test all three before putting value on your list.
A smaller backlog with profitable, collectible jobs can be worth more than a larger backlog that locks scarce crews into thin work.
Use this purely illustrative hypothetical, not reported benchmark data. A $900,000 headline backlog might hold only $600,000 of firm work. Of that, only $450,000 might be funded, and the weakest $300,000 might carry an 18 percent margin.
That doesn’t make the business bad. It makes the actual planning number $450,000 of funded, firm work, with a pricing problem to fix on the rest. Hiring or borrowing against the full $900,000 would overstate what’s dependable.
Material prices, labor availability and customer delays can all change after signing, which is why margin needs refreshing with current costs. A job that looked fine when quoted can eat cash if you never reprice its remaining work on paper.
Keep your per-job check brutally short. For each job, record firm yes or no, funded yes or no, margin band and expected payment month. Four fields will tell you more than a polished total ever will.
A shop owner looks at eight months of signed work and feels covered. Then two people call in sick, a material delivery slips, and the deposit on the biggest job still has not cleared. The dates on the contracts have not moved. The crew and the bank balance have.
A backlog can look strong on paper and still be undeliverable. The capacity test asks a blunt question. Can your current people, equipment, subcontractors and cash finish this work by the dates you have promised? A long list that outruns those four things does not protect the business. It ties scarce crews to jobs you cannot finish on time, and it can pull cash into labor and materials before the customer pays.
An Engineering News-Record report on 2025 construction markets noted overall U.S. construction backlog was about 8.4 months in October 2025, yet heavy industrial backlog reached 8.8 months and infrastructure reached 9.8 months, while smaller firms saw the steepest decline, and one in five contractors had a project interrupted or paused because of tariffs. A national average can sit next to a very different number for your trade. Your own headline can do the same if part of those months is work you cannot staff, supply or bill.
Schedules, open items and jobs waiting on people or materials are where that pressure shows up first.

Stress-test your capacity figure for absenteeism, hiring delays, supply interruptions, customer deferrals and warranty callbacks. Each one eats days you already promised to someone else. If you are weighing whether to add flexible help instead of rushing a permanent hire, Voicedial.ai’s guide to staff augmentation can help you think through that option in practical terms. Documenting how that coverage fits your operation also connects to the broader business systems and processes a buyer will later examine.
The Official Kanban Guide defines lead time as elapsed time from a work item’s commitment point to completion and throughput as the number of items completed per unit of time. For trades work, turn that into four weekly fields: total open items, age of the oldest item, jobs completed per week and median time from scheduling to completion.
Open item count shows whether inflow is beating completions. Oldest item age shows who has been waiting too long. Completions per week show real throughput, not the pace you hoped for when you signed the work. Median cycle time shows how long a normal job takes once it starts. A tidy open-job total can mislead the way a full bay board misleads a body shop: ten vehicles on the wall mean little if three are waiting on parts and two are warranty returns that bring in almost no cash.
Group the list before you try to fix it. Quoted but unscheduled, scheduled and waiting for materials, active, warranty callbacks and administrative tasks each need a different response. The PMI Lexicon of Project Management Terms supports treating a backlog as ordered and prioritized, not as an unstructured pile. Rank by promised date, customer impact and cash impact, and delete obsolete items.
| Warning Sign | Likely Cause | Fix |
|---|---|---|
| Backlog far shorter than your normal range | Weak new bookings or slow follow-up on quotes | Follow up on open quotes weekly and set a monthly bookings target |
| Backlog far longer than your normal range | Understaffing, subcontractor gaps or delivery delays | Add crew or subcontract, then sequence jobs by promised date |
| Oldest open item keeps aging | Scheduling gaps or materials not on site | Set an aging limit and review aged items weekly |
| Backlog grows while margin falls | Underpriced jobs signed in a rush | Reprice new quotes and review cost per job monthly |
| Large backlog, slow cash | Missing deposits or infrequent billing | Require deposits and bill at defined milestones |
A controlled queue is the working target: inflow, capacity, aging and cash priority stay visible before customers start calling to complain.
Before a budget, sale or succession decision, pull four figures from your monthly sheet. You need dollar backlog, months of backlog, capacity-adjusted backlog and funded share, checked against the per-job firm, funded, margin and payment flags. Without those flags, you’re deciding from a headline.
A budget built on the full headline can overstate revenue and push you into overstaffing. A buyer will verify only what’s signed, funded and documented, which is why your sheet should show deposits, terms and current margin. Succession planning needs the same honesty, because the next owner or manager must be able to deliver the work without you personally holding every customer relationship.
That review also feeds practical deal questions such as the working capital peg, because deposits collected, work in progress and upcoming labor costs affect the cash a business needs at closing. For the scheduling side, planning work around shifting deadlines offers a useful way to think about reprioritizing when dates move without losing the whole queue.
Keep the routine to one sheet and about one hour a month. Our founder holds that owners in trades and manufacturing don’t have time to sort through a long list of maybes, and we built The Owner’s Shortlist after watching owners spend months talking to advisors who had good websites and confident pitches but thin track records with businesses like theirs. Nothing here is legal, tax or financial advice, so confirm major decisions with your own advisors.
If you’re starting to think about selling or stepping back, bring that one-page backlog sheet with you and talk to a real person who can review your business and introduce you to one specialist whose past work fits your company. Visit The Owner’s Shortlist to start that quiet, no-pressure conversation and see how a buyer is likely to read your signed work.
Who wrote this: The Owner's Shortlist is not a broker and doesn't sell businesses. We get paid the same no matter which specialist we introduce you to. More about how we work.
Tell us your situation. We'll connect you with a specialist who works with owners like you. One conversation, no sales pressure.
Found this useful?
Add The Owner's Shortlist as a preferred source and get our articles highlighted in Google Search results.
Add to Preferred SourcesLearn accretive vs dilutive: when EPS rises or falls, how financing flips the result, and what service-business owners should ask before a sale.
November 1, 2026
Selling the business doesn't mean selling the building. Here's how a sale-leaseback works, what rent to charge, and what you give up along the way.
September 25, 2026
Business loan vs line of credit explained for owners. Compare cost, flexibility, collateral, cash-flow impact, and the right scenarios for trades and SMBs.
September 24, 2026
Understand seller financing tax implications for owners, from installment sale rules and capital gains to depreciation recapture and state tax considerations.
September 16, 2026