Business Valuation Meaning for Owner Operated Firms
Explore business valuation meaning for owner-operated firms. Learn valuation methods, drivers, misconceptions, and steps to secure a defensible valuation.
September 28, 2026
By Remi Taffin · August 12, 2026
You’re sitting at your desk with a year-end P&L open, a buyer on the calendar, or a lender asking for “TTM revenue and EBITDA,” and the numbers in front of you feel older than the conversation you’re about to have. Your accountant handed over a fiscal-year statement, maybe a year-to-date summary too, but neither one seems to answer the core question: what has the business accomplished over the most recent 12 months?
That’s where trailing 12 months comes in. It sounds technical, but for an owner, it’s really just the cleanest way to talk about the business as it stands right now. If you’re preparing for a sale, a financing meeting, or an internal review, TTM helps you replace stale annual figures with a rolling view that matches how buyers and lenders think.
A plumbing owner gets a call from a prospective buyer. The buyer says they want TTM revenue and TTM EBITDA before the next meeting. The owner opens the P&L, sees the last fiscal year, and thinks, “Why isn’t that enough?”
That reaction is normal. Most owner-operated businesses are run, reported, and taxed by a fiscal year or calendar year. The business may have a December close, a March close, or a tax return that feels like the official record of truth. But the conversation with a buyer or lender usually isn’t about last year. It’s about what the business looks like now, after the last quarter, the last busy season, and the last slow month.

The phrase trailing 12 months gets confusing because it sounds like accounting jargon, but it’s really a timing question. The buyer wants a window that includes the most recent 12 consecutive months, not a report that ended months ago and no longer reflects the business’s current run-rate. A lender asks for the same thing because the repayment decision depends on current performance, not just historical filings.
Practical rule: if the question is “What has the business done recently enough that I can underwrite it?”, TTM is usually the right starting point.
Once you see it that way, the term stops feeling abstract. It becomes a practical tool for sale prep, lender review, and internal planning, especially when the fiscal year no longer tells the whole story.
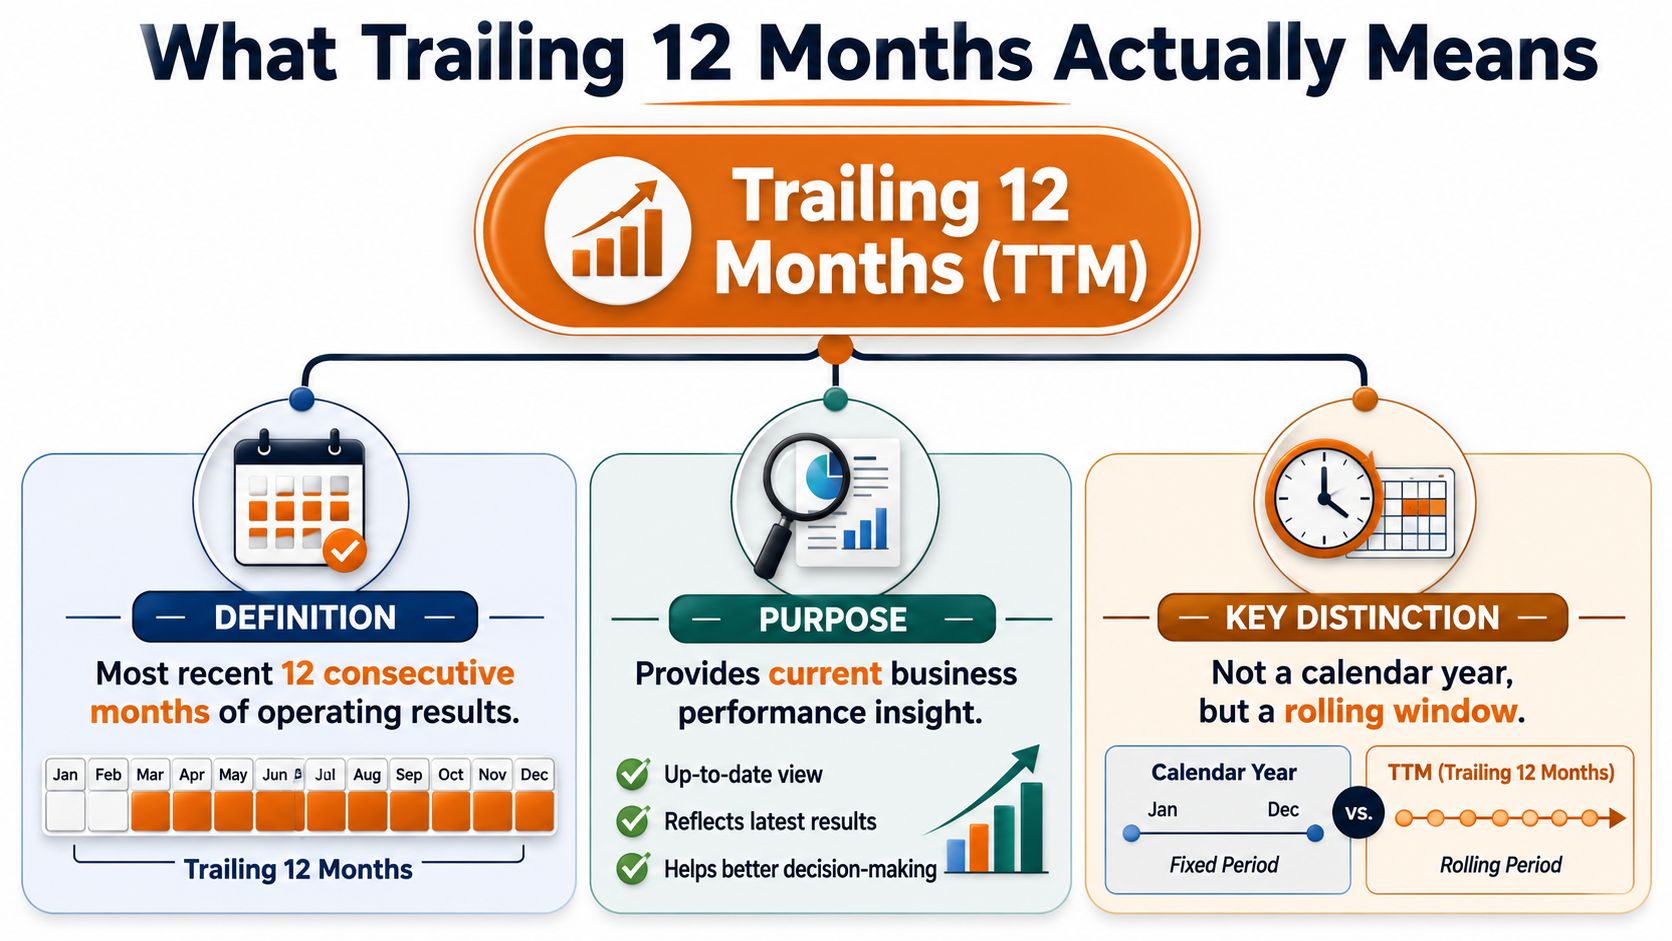
TTM is a rolling, backward-looking measure that captures the most recent 12 consecutive months of operating results. It moves forward as each new month closes, so the view stays closer to the business’s current run-rate than a completed fiscal-year report that may already be stale by the time an owner starts a sale process, lender meeting, or internal review. Standard finance usage applies the term across revenue, EBITDA, EPS, and cash flow discussions, as outlined in Investopedia’s TTM overview.
A fiscal year is a fixed reporting period. It begins and ends on set dates, which makes it useful for accounting and tax reporting, but it can miss what the business looks like right now.
TTM works differently. The window keeps sliding. Each new month enters the front, and each month that falls outside the last 12 months drops away from the back. That rolling structure gives owners a current operating view without turning the number into a forecast.
Year to date, or YTD, only covers the months that have happened so far in the current year. That can help with tracking progress inside the year, but it leaves out the comparable months from the prior year. In a seasonal business, that can distort the picture because YTD may catch only the slow stretch or only the busy stretch.
TTM keeps the full 12-month operating cycle in view. A heating and cooling contractor, for example, wants to know how the business performed through both the summer rush and the winter slowdown, not just the months that have already passed in the current year. That is why buyers, lenders, and advisors often treat it as a clearer operating lens than either YTD or a stale annual report.
Clean way to think about it: fiscal year is a fixed snapshot, YTD is a partial update, and TTM is the rolling picture owners and financing partners use when they need a current decision view.
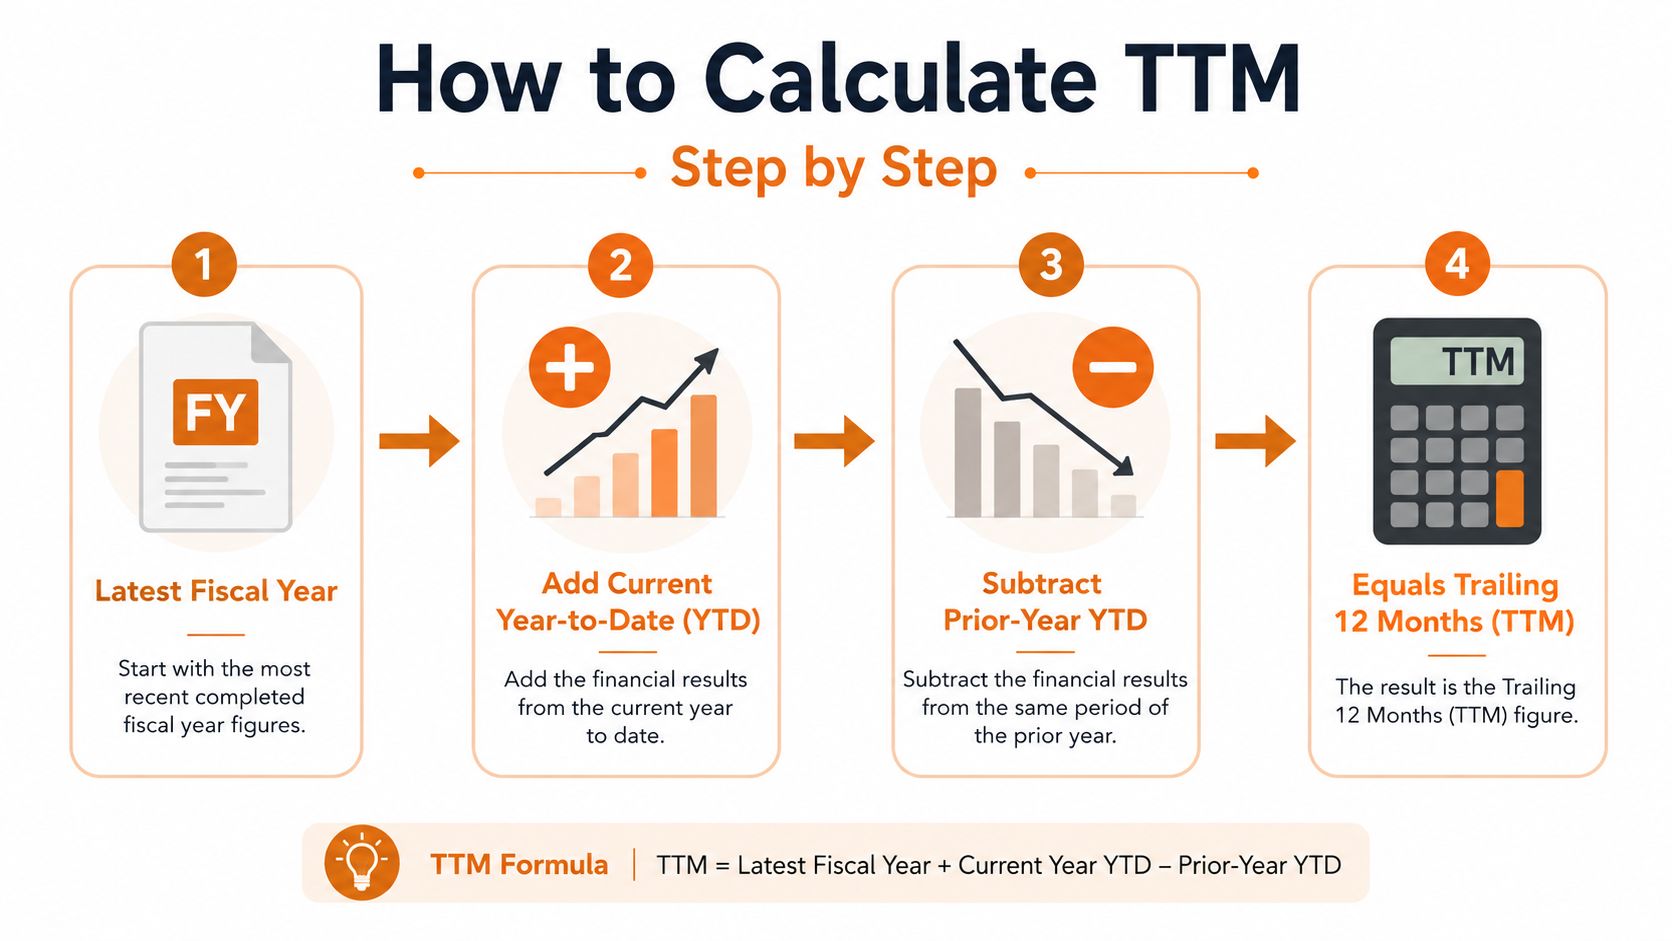
The standard formula is the one most owners can use on paper: latest fiscal year + current year to date − prior-year year to date. That structure works because it removes the months you no longer want from the earlier year and replaces them with the newest months from the current year. It’s the simplest way to turn two partial periods into one rolling 12-month view, and it’s the calculation most advisors expect you to understand.
Say your last fiscal year revenue was 3.2M, your current YTD revenue is 1.8M, and your prior-year YTD revenue was 1.5M. The math is straightforward:
That gives you a TTM revenue figure of 3.5M.
The reason this works is easier to see if you think about the months on a timeline. The fiscal-year number already includes a full year of activity. The current YTD number adds the fresh months that happened after that fiscal year ended. The prior-year YTD number is the overlap you have to remove so you don’t double count those earlier months.
You can use the same formula for EBITDA, gross profit, net income, or cash flow as long as the source periods are matched correctly. The label changes, but the logic doesn’t. You’re still building the most recent 12-month window from annual and year-to-date pieces.
For owners, that’s the true value. You don’t need a special report to understand the idea. You need the last annual statement, the current YTD detail, and the prior-year YTD detail lined up on the same basis.
Consider an HVAC company with maintenance contracts, replacement jobs, and seasonal demand. It is a clear way to see TTM in real life, especially when the owner is getting ready for a sale, a lender meeting, or an internal review. A slow first quarter can make the current year look weak, then a busy summer can change the picture fast. If you only look at one quarter, it is easy to tell yourself the wrong story.
TTM smooths those swings into one rolling 12-month view. It keeps the winter slowdown, the spring contract renewals, the summer installation rush, and the fall service work in the same window. That matters because a buyer is not underwriting a single quarter. They are trying to understand the business’s current operating run-rate across an entire cycle, the way a mechanic listens to the full engine, not just one loud sound.
A maintenance agreement base can make TTM more useful than a raw quarterly snapshot. The recurring contracts help show what is steady, while the seasonal jobs show what is variable. Viewed together, the owner gets a better sense of whether the business is holding its pace or depending too heavily on one strong period.
Owners typically find that this is the part the accountant’s fiscal year report can hide. A year-end statement can look clean, but it may blur the months that matter most right now. TTM keeps the recent operating pattern in view, which is what a buyer or lender usually wants to understand.
TTM is useful, but it is not magic. A large commercial installation can make the figure look better than the ongoing service business really is. A backlog that has not been billed yet can also make the current period look lighter than the work pipeline suggests. The same is true when unusual demand spikes or temporary market conditions push revenue away from the ordinary run-rate.
TTM helps you see the business as it has performed over the last 12 months, but it does not automatically tell you how repeatable those 12 months are.
That is why the number needs context. If the business had a one-time surge, a canceled contract, or a project timing shift, the TTM figure is still real, but it may not be the whole underwriting story.
The raw TTM number you pull from accounting software is usually not the number a buyer uses. Buyers look for normalization, which means they try to separate recurring operating performance from items that distort it. That is where many owners get surprised, because the business may have strong reported earnings while the adjusted number looks different once the buyer strips out unusual items.
Common adjustments usually include owner compensation, family payroll, one-time legal or repair expenses, non-recurring revenue, and personal expenses run through the business. If an owner pays themselves above market, the buyer may adjust that compensation to reflect a replacement manager’s cost. If a spouse or child is on payroll but not doing operating work, that can also get reviewed. If a one-time truck repair or legal expense hit the books during the TTM period, a buyer may ask whether it’s part of normal operations.
TTM EBITDA becomes more than a formula. It becomes the starting point for a valuation conversation. The buyer wants to know what the business earns on a repeatable basis, not just what the tax return shows. That adjusted view is what usually drives pricing discussions and financing comfort.
If you’ve never done this before, the concept is close to seller discretionary earnings, but the point here is narrower. TTM gives you the rolling 12-month base, then normalization adjusts that base so the buyer can see the operating reality more clearly. A helpful reference point is this overview of seller discretionary earnings.
A clean TTM number doesn’t mean you’re done. It means you’ve reached the point where the business can be discussed on a consistent basis instead of through a stack of mixed-period reports.
Buyers, lenders, and advisors all use TTM, but they use it for different reasons. Buyers want to value the business. Lenders want to understand repayment capacity. Advisors want a current baseline they can compare against prior periods and against whatever else is in the file. The common language matters because each group is trying to answer a slightly different question from the same financial history.
Buyers usually start with TTM because it gives them the freshest operating picture available. Lenders use it because they need current income support, not just last year’s results. Advisors use it to see whether the business is moving in the right direction, whether margins are holding, and whether the owner’s story matches the numbers. In a due diligence setting, a closer look often leads to a quality-of-earnings review, especially when the headline figures and the adjusted operating story don’t line up. For a plain-language overview, see what a quality of earnings report covers.
| Use Case | What TTM Tells the Reader | Typical Decision Driven |
|---|---|---|
| Sale prep | The most current operating baseline | Whether the business is ready for buyer review |
| Lending | Recent earnings strength and repayment support | Whether financing appears supportable |
| Internal review | Whether performance is improving or slipping | Whether management should change course |
That table is why TTM matters. It’s not just an accounting label. It’s the figure that lets different professionals talk about the same business without arguing over which period should count.
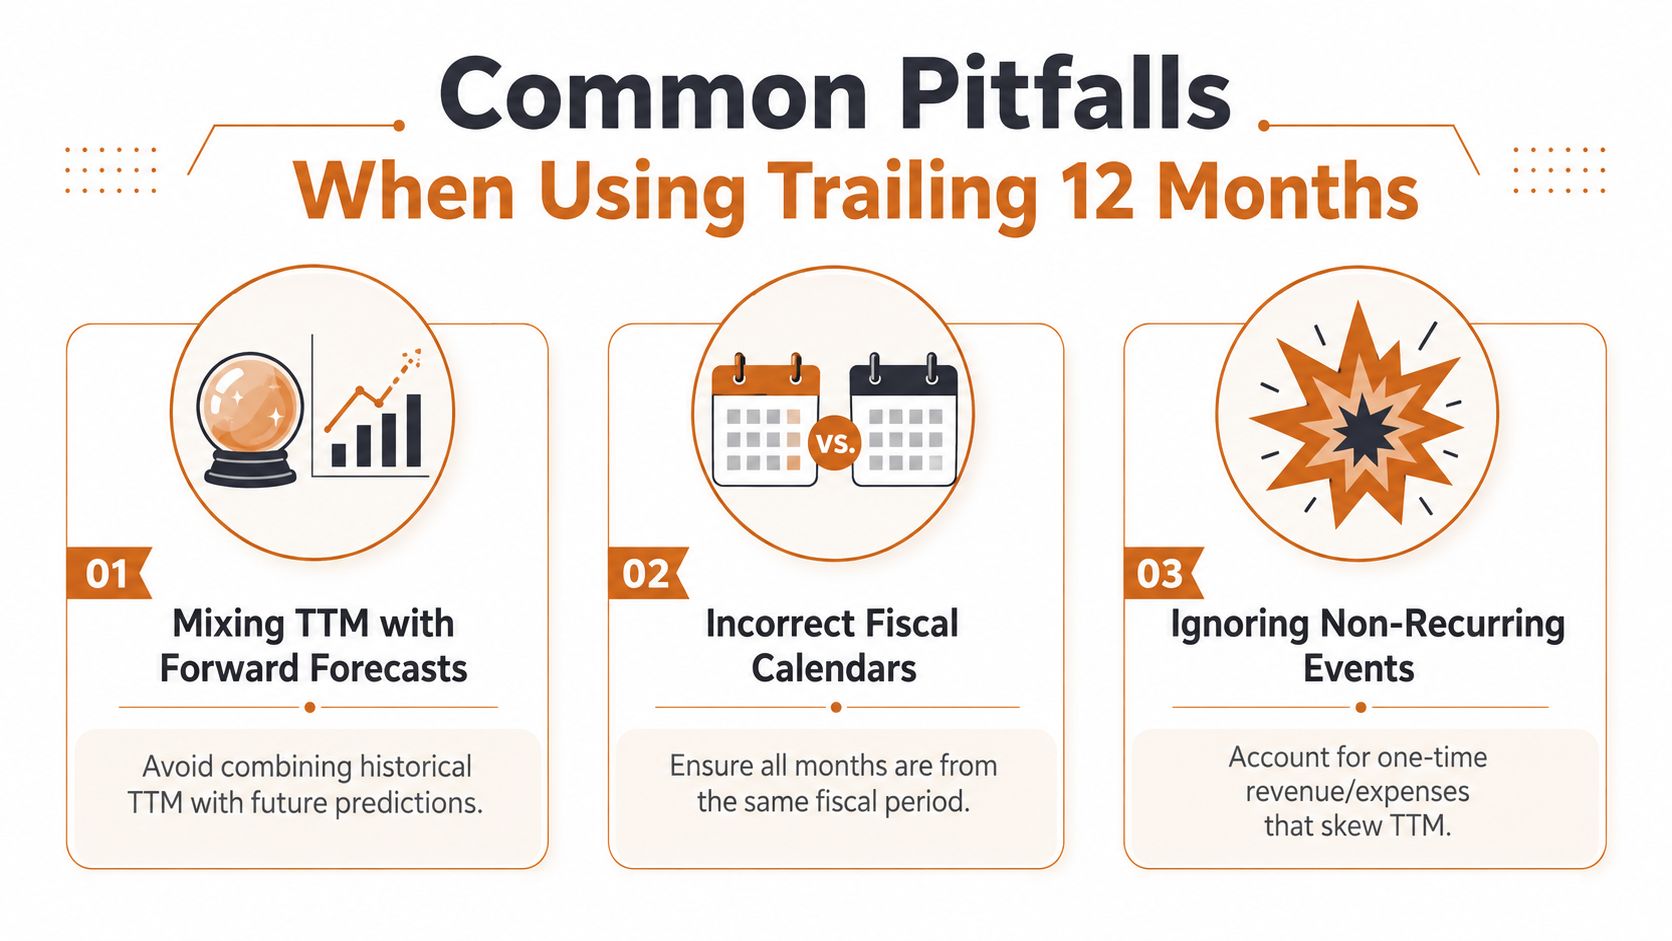
The biggest mistake owners make is treating TTM like a forecast. It isn’t. It’s historical, just more current than a full-year report. If someone starts blending a backward-looking TTM number with future projections, the conversation stops being about actual performance and starts becoming a guess.
Another common error is mixing months from different reporting calendars. If one report is on a fiscal-year basis and another is on a calendar-year basis, the window won’t line up cleanly. The result can look precise while still being wrong. The fix is simple, but it matters, make sure all 12 months are from the same rolling period before you use the number.
Owners also overreact to a single unusually strong quarter. That quarter may have been driven by a large project, a timing shift, or a temporary surge in demand. TTM helps soften that noise, but only if you resist the urge to annualize one quarter and call it the full story.
If the business had a one-time event, ask whether the figure reflects a repeatable pattern or just a lucky month.
That’s the right question to ask in a lender meeting, a sale conversation, or an internal review. TTM is useful because it filters noise, but only if you respect what it can and can’t tell you.
Before you speak with a valuation specialist, lender, or advisor, pull three things together first, the latest fiscal year, the current YTD, and the prior-year YTD. Check that the periods line up correctly, then flag anything unusual, such as one-time repairs, legal costs, unusual owner pay, or non-recurring revenue. That simple prep work keeps the conversation focused on the business instead of on spreadsheet confusion.
A clean one-page TTM summary is usually enough to start. It doesn’t need to be fancy. It needs to show the period logic clearly so the other side can follow the numbers without guessing what got included or excluded.
If you want help deciding what kind of specialist fits your situation, this overview of how to find a business valuation specialist is a useful next step.
If you’re getting ready for a sale, lender meeting, or internal review, The Owner’s Shortlist helps you make sense of the numbers before you bring in a specialist. Visit The Owner’s Shortlist to find plain-language guidance and vetted specialists who work with owner-operated businesses like yours.
Tell us your situation. We'll connect you with a specialist who works with owners like you. One conversation, no sales pressure.
Found this useful?
Add The Owner's Shortlist as a preferred source and get our articles highlighted in Google Search results.
Add to Preferred SourcesExplore business valuation meaning for owner-operated firms. Learn valuation methods, drivers, misconceptions, and steps to secure a defensible valuation.
September 28, 2026
What Is Recurring Revenue. Learn what recurring revenue is, how ARR and MRR work, real trade examples, and why this revenue model shapes business value and exit
September 23, 2026
Learn how much to sell a business for with SDE and EBITDA multiples, adjustments, and deal tips to set a defensible price and maximize proceeds.
September 21, 2026
Understand business valuation cost, fee structures, price ranges and what drives fees so you can budget wisely and get accurate quotes.
September 19, 2026