How Much Is a Landscaping Business Worth? Valuation Guide
Most owner-run landscaping businesses sell for about 2 to 3 times what the owner earns. Here's what moves that number up or down, with real sale data.
November 15, 2026
By Remi Taffin · November 15, 2026
The figure owners most often hear for manufacturing company valuation multiples comes from a deal set that would never include their plant. Across 353 industrial-manufacturing transactions reported in the first half of 2017, the median transaction-value-to-EBITDA multiple was 9.5x, while the median transaction value was $277 million, according to EdgePoint’s industrial manufacturing review. Private deals in the lower and middle market have changed hands well below that level for most of the past two decades.
That gap isn’t a pricing error. It’s what buyers pay for scale, professional management, diversified customers and cheap capital. A manufacturer doing $8 million in revenue with one owner and two dominant accounts competes for a different pool of buyers than a $200 million platform.
So this walkthrough gives you: a working range instead of a single number. Benchmarks by period, then by size band, then by subsector, then by earnings quality, with the adjustments buyers make before they apply any multiple at all. Run your own figures through each step and you’ll land on a range you can defend in a room with a buyer.
The most useful starting range comes from transaction databases that track private deals, not from headline figures built on the largest platforms. For an owner-operated plant, the benchmark is the average paid for businesses of similar size, then the spread around that average.
| Source | Period | Average EV to EBITDA | Deal set |
|---|---|---|---|
| GF Data manufacturing sample | 2003 to 2014 | 5.9x across 883 transactions | Acquisitions valued $10M to $250M |
| GF Data manufacturing sample | 2014 | 6.1x | Acquisitions valued $10M to $250M |
| Taureau Group manufacturing average | Full-year 2023 | 6.5x | Manufacturing companies in its newsletter sample |
| Taureau Group manufacturing average | Through Q2 2024 | 6.8x | Manufacturing companies in its newsletter sample |
Two lessons sit inside that table. The long-run GF Data average and the more recent Taureau readings live in the same neighbourhood, so a manufacturer with ordinary earnings quality should treat the mid-to-high single digits as the starting band. And the band matters more than the midpoint. Inside the GF Data set of 2,018 acquisitions, reported multiples ran from 3x to 12x trailing-twelve-month adjusted EBITDA, meaning buyers paid four times more at the top of the range than at the bottom.
Later middle-market series and broad market headlines often print higher figures, but they change the sample, the period and the deal mix. A double-digit market average describes the arithmetic of an entire market, including large platform transactions and strategic premiums. It does not describe a typical plant with one owner and concentrated customers.
Making tangible goods does not earn a premium multiple by itself. Buyers underwrite normalized EBITDA first, then test what supports it: recurring demand, customer concentration, management depth, maintenance capital expenditure and whether the operation transfers without the owner. Weak margins, volatile orders, heavy owner dependence or large deferred equipment needs pull a business toward the bottom of the range.
Every benchmark is only as good as the sample behind it, so read how Statlyst verifies its statistics before quoting any average to a buyer.
A valuation multiple works like an exchange rate. It converts one unit, a dollar of normalized EBITDA, into another, a dollar of enterprise value, and the rate you get depends on how much of your earnings story a buyer can verify. Everything after the multiplication is a negotiation about the two halves of that sentence.
For lower-middle-market manufacturing transactions, enterprise value to trailing-twelve-month EBITDA is the more decision-useful benchmark than a revenue multiple, because it strips out differences in financing, tax structure and operating margin. Two manufacturers with identical sales can carry very different profits, and a revenue multiple hides that completely. Overall manufacturing sits at roughly 6.9x in that dataset, and the figure narrows once you match it to enterprise value, subsector and earnings quality.
The five steps below turn a tax return and a P&L into a number a buyer will discuss.
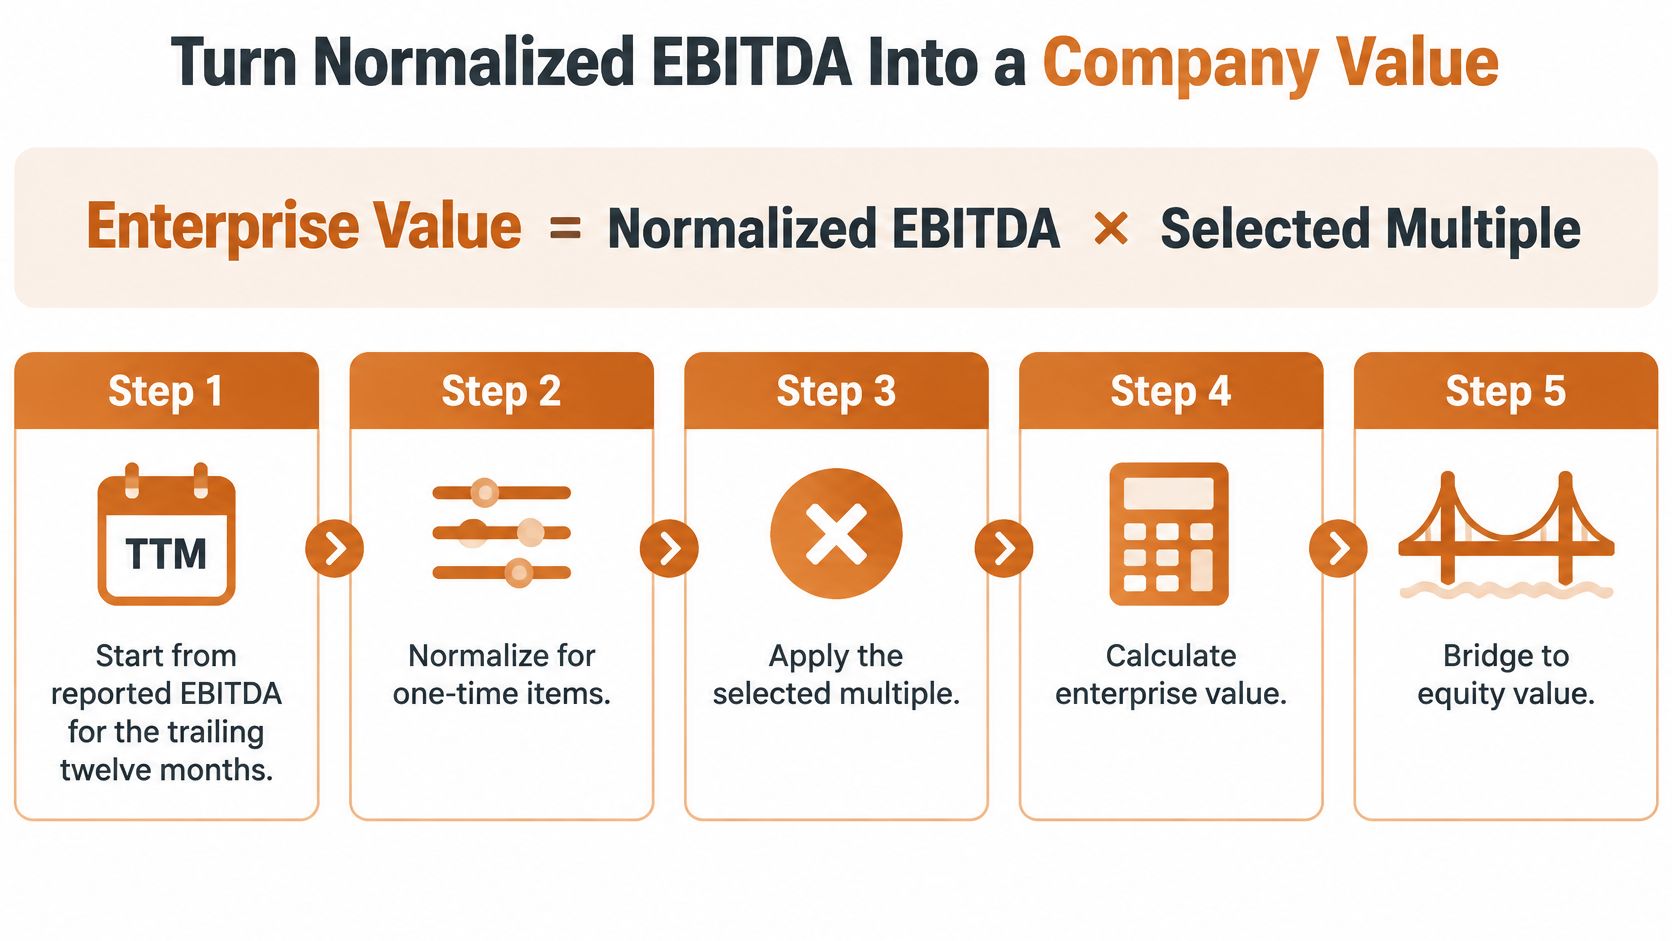
Start with reported EBITDA for the trailing twelve months. Use the period a buyer would use, not your best quarter, and reconcile it to your tax return before anyone else does.
Normalize it. Most of the work sits here, and most of the disagreement happens here too.
Match the multiple to size, subsector and earnings quality. Pull the band that fits your deal, then decide where inside it your business belongs.
Multiply. Normalized EBITDA times the chosen multiple gives enterprise value.
Bridge to equity. Subtract debt and debt-like items, add excess cash, then adjust for working capital and the specific terms of the deal.
The normalization step deserves its own table, because a buyer will rebuild your earnings line by line before selecting a multiple.
| Adjustment | How buyers treat it | Effect on normalized EBITDA |
|---|---|---|
| Owner pay above market | Add back the excess, deduct a market-rate replacement salary | Raises it |
| Personal expenses run through the business | Add back with supporting records | Raises it |
| One-time repairs or unusual legal costs | Add back when documented as nonrecurring | Raises it |
| Related-party rent below market | Reset rent to market level | Lowers it |
| Temporary tariff benefits or inventory gains | Remove because they are not recurring | Lowers it |
| Maintenance capital expenditure | Deduct in any cash-earnings view | Lowers cash conversion |
The test that matters: if you can’t attach a document to an add-back, a buyer will take it out.
Say a fabricator reports $2 million of normalized EBITDA. At a 5.7x to 6.9x range, that implies about $11.4 million to $13.8 million of enterprise value before balance-sheet adjustments. That spread is roughly $2.4 million wide, which is why arguing the multiple matters as much as defending the earnings figure.
Now bridge it. Suppose the same company carries $1.2 million of debt and $300,000 of excess cash. Equity value lands near $10.5 million at the low end of the range, and that is the number a shareholder receives before tax. Enterprise value prices the operating business; equity value is what remains once the balance sheet settles.
Quality of earnings moves the multiple, not just the earnings. Through the first three quarters of 2025, U.S. manufacturing deal volume was down 21% year over year even as deal value rose 58%, largely because large platform transactions lifted the aggregate, per a 2025 manufacturing M&A industry report. The same report notes that trade and tariff uncertainty kept weighing on transaction momentum, and buyers favoured manufacturers with limited tariff exposure, durable aftermarket revenue and qualified supply chains.
That produces a result owners find counterintuitive. A manufacturer with lower reported EBITDA but domestic sourcing, pass-through pricing, repeat parts revenue and modest maintenance capex needs can command a better multiple than a faster-growing company exposed to imported inputs and heavy reinvestment.
Separate EBITDA from cash earnings as well. An asset-heavy plant can show an attractive EBITDA multiple while demanding substantial recurring capital expenditure, and the buyer financing that plant will deduct maintenance capex in a cash-earnings view. If you want the mechanics laid out separately, this walkthrough of how EBITDA-based valuation works in practice covers the same ground from the buyer’s side. Buyers repeat this exercise on your numbers, so the supporting schedule matters more than the headline. For businesses assembling that file outside the U.S., services such as company valuation support for UK scale-ups exist for this stage of the preparation.
Rerun the arithmetic with your own trailing twelve months, your own add-backs and the band that fits your enterprise value, rather than with the sector average.
The widest gap in the data isn’t between subsectors. It’s between deal sizes.
Smaller U.S. manufacturing deals with $10 million to $25 million of total enterprise value averaged about 5.8x EBITDA in the first half of 2025, while the largest transactions averaged 9.9x, according to True North’s market update. Another 2025 manufacturing dataset reported overall sector multiples of 5.7x to 7.9x, with a median near 6.6x. A separate report covering broader manufacturing M&A showed 11.5x for 2025, which is exactly how headline figures get distorted by large platform deals and strategic premiums.
| Deal size band (total enterprise value) | Typical multiple | Why the multiple moves |
|---|---|---|
| $10M to $25M | About 5.7x (Q1 2025); about 5.8x (first half 2025) | Owner-led sellers with thinner management |
| $25M to $50M | About 6.3x | Better reporting and more management depth |
| $50M to $100M | About 6.9x | Broader customer base and more financing options |
| $100M to $250M | About 7.7x | Scale and professional management |
| Largest transactions | About 9.9x (first half 2025) | Platform and strategic buyers paying for scale |
Each step up the table buys something a buyer can measure. Deeper management means the business doesn’t stop when the owner takes a holiday. Better reporting means the buyer can audit the earnings without rebuilding the ledger. A broader customer base means no single account can halve the profit. And more financing options mean lenders will advance more against the deal, which supports a higher price.
The same logic explains why a listed comparable can look far more expensive than a private transaction. Public companies offer scale, liquidity, professional management, disclosure and access to capital that an owner-operated manufacturer usually doesn’t. Transplanting a public trading multiple onto a smaller business ignores all of it.
Buyer type matters just as much as size. A financial buyer prices the cash flow and the management team it has to keep. A strategic buyer can pay more when your customers, territory or product line fill a gap in its own operation, and it will want to see how you fit. An individual buyer is usually the lowest bidder for a business of real scale, because the money and the risk sit in one place.
Which set resembles you? Match on revenue, EBITDA quality, customer concentration and owner dependence before you match on multiple.
The difference between a strategic buyer and a financial buyer shows up in structure and in price, and it’s worth understanding before you take a meeting with either.
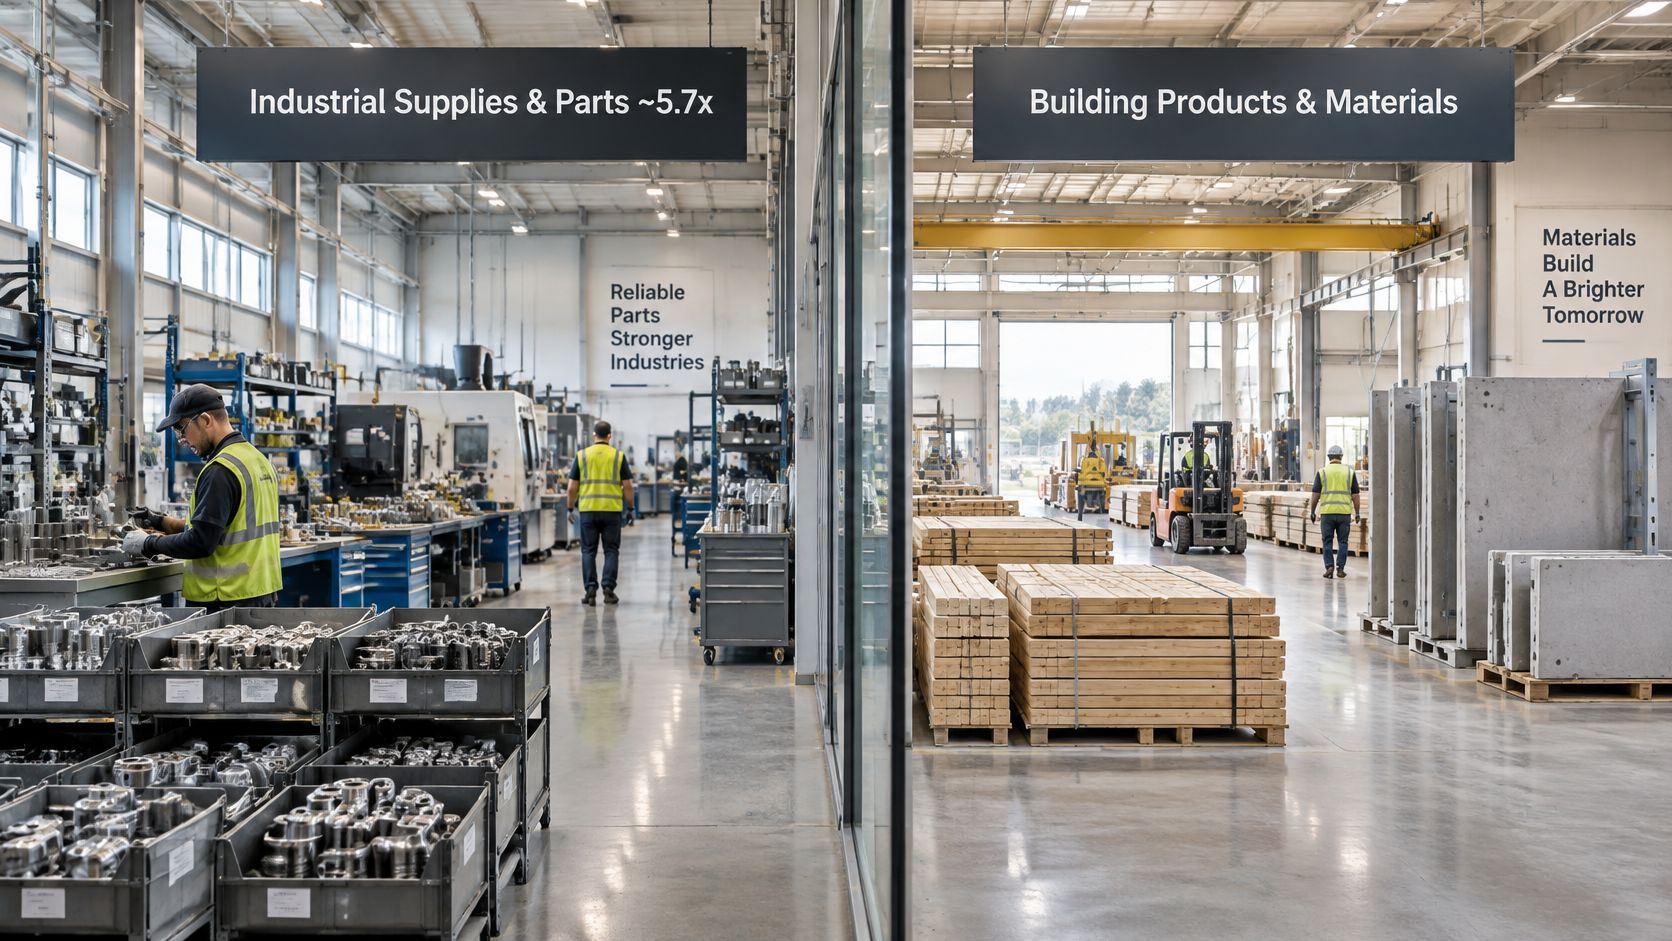
A manufacturer’s subsector sets a starting range before anything specific to the company is considered. A parts supplier and a food producer both make things, and buyers treat them differently.
| Subsector | Reported multiple | Position in reported range |
|---|---|---|
| Industrial supplies and parts | About 5.7x | Lowest reported subsector |
| Building products | About 6.5x | Mid-range |
| Overall manufacturing | About 6.9x | Sector-wide reference |
| Food products | About 7.9x | Highest reported subsector |
Within that starting range, a handful of company traits decide where you sit. Each one works through the earnings, not through sentiment.
Customer concentration is the biggest single lever. If the top customer is 40% of revenue, the buyer isn’t buying your profit, it’s buying that account’s next purchasing decision. Diversified order books with no account above 10% support a premium for obvious reasons, and the mechanics are explained in this guide to customer concentration risk.
Proprietary products and defensible share let a manufacturer hold price when input costs rise. Buyers pay for pricing power because it protects the margin they’re underwriting.
Recurring aftermarket and parts revenue steadies cash flow between equipment cycles. A machine sale that generates ten years of spares and service is worth more per dollar of profit than a one-off build.
Owner dependence is the quiet discount. When pricing, key relationships or technical know-how sit with one person, the buyer has to fund a replacement and absorb the risk of the handover, and the offer reflects both.
Equipment intensity works against you in a different way. Heavy plant means heavy maintenance capex, and capex comes out of the cash the buyer is valuing, even when the EBITDA looks strong.
A strong trait offsets a weak one only when the buyer can verify it in the records, not when it’s described in a meeting.
Score yourself on all five before a buyer does it for you. Most owners find one trait carrying the business and one dragging on it, and the second is usually the one that responds to two years of documentation.
A 10% drop in EBITDA doesn’t cut your company’s value by 10%. When the multiple falls at the same time, the two effects multiply.
The pattern is visible in recent data. One 2025 market summary reported manufacturing averaging about 6.5x TTM adjusted EBITDA in the first half of 2025, down from 7.0x in 2024, and a second report attributed a decline from 7.0x in 2024 to 6.6x in 2025 partly to tariff-related input-cost uncertainty and softer demand, particularly in unbranded consumer manufacturing, per a 2025 manufacturing valuation newsletter.
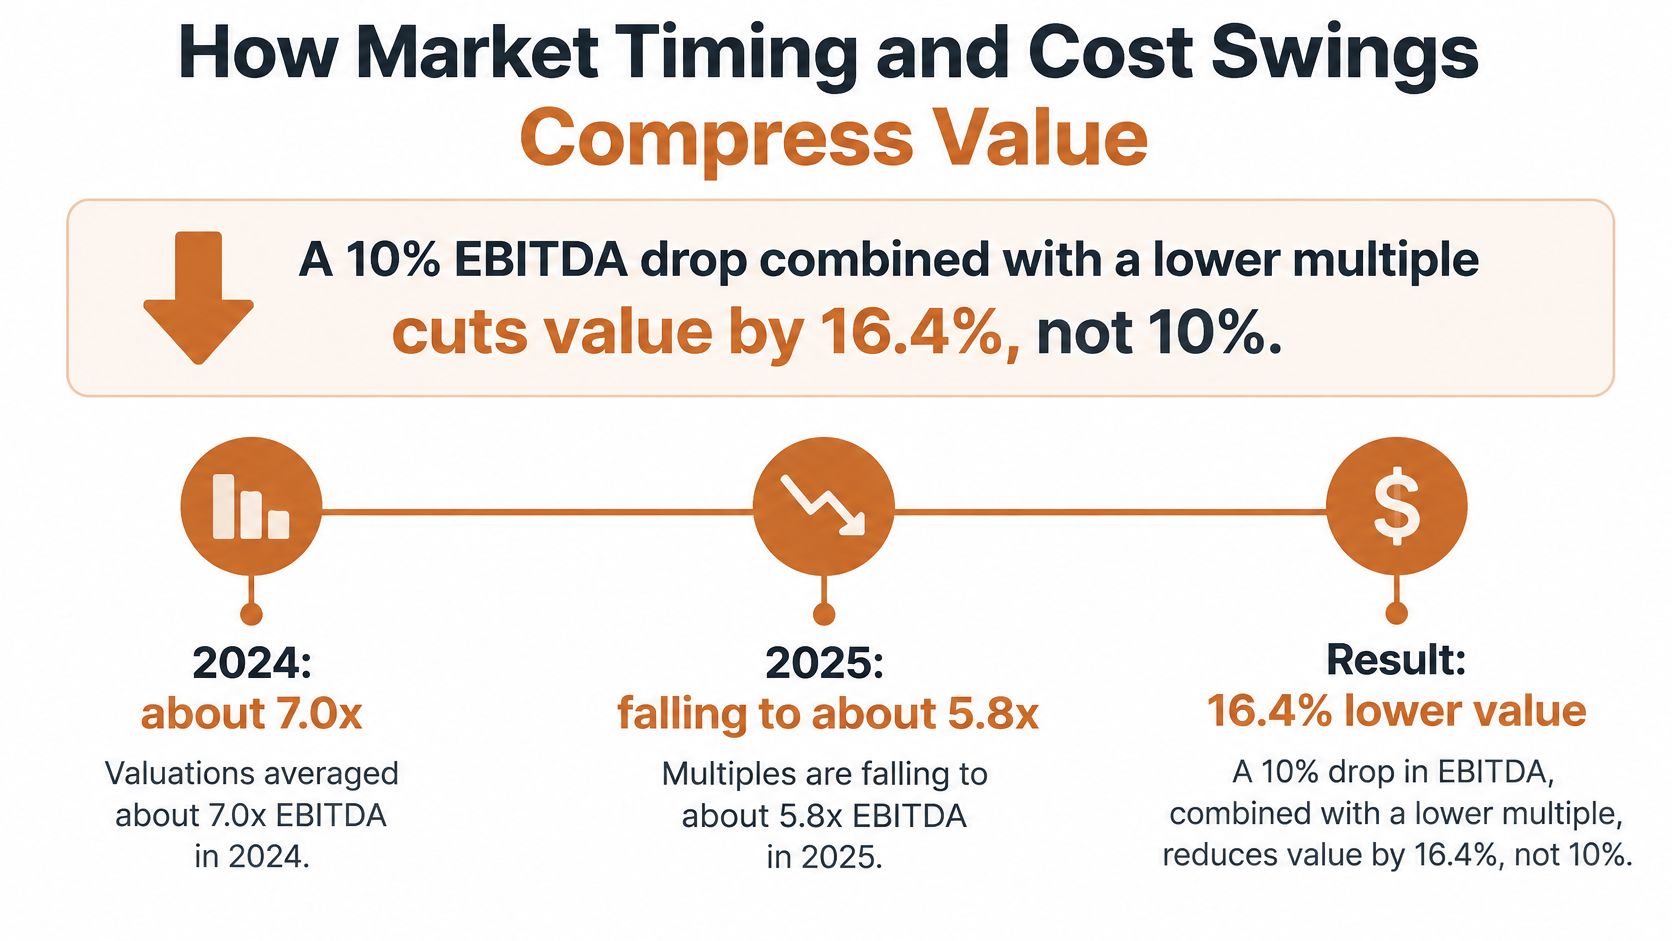
A buyer runs that arithmetic before making an offer, and so should you.
Volatile steel, resin, energy, freight or labour costs reduce confidence in forward EBITDA, even when this year’s revenue looks stable. The buyer reads a cost line it can’t predict, and it protects itself in one of four ways: a lower multiple, a normalized margin assumption, an earnout tied to future performance, or a working-capital adjustment at closing. None of those are insults. They’re the price of uncertainty.
Defend the multiple with paper, not with optimism. Price-pass-through records and a documented margin history do more for your valuation than a strong quarter.
The owner who has already modelled both cases walks into the meeting knowing which one needs defending. That’s a stronger position than quoting a sector average and hoping the buyer agrees with it.
Three moves settle the question. Pick the benchmark set closest to your business, meaning the size band, the subsector and the likely buyer type. State a working range rather than a single number, then move it up or down for the earnings adjustments, the customer mix and the current cost environment. Then assemble the file that supports your position.
The document list is short enough to finish in a month and specific enough to change the outcome.
A specialist who has sold manufacturers of your size can test that range against real transactions rather than published averages, which is the difference between a defensible number and a hopeful one. The Owner’s Shortlist publishes a guide explaining how a business is valued and the methods specialists use, and it can introduce you to one whose past work fits your business. Owners pay nothing for that introduction, and there’s no obligation after it.
Before you speak to any buyer, rerun the calculation one more time with your own trailing twelve months and your own documented add-backs. The number you arrive at will be lower than the headline you’ve been quoting. It will also be the one that survives due diligence.
Most owners arrive at this topic with a number they heard at a trade show and leave with a range, a schedule and a short list of documents that justify both. The Owner’s Shortlist is built for that stage: a guide to how a business is valued and the methods specialists use, plus a hand-picked introduction to one specialist whose past deals match your industry and size. There’s no cost to you and no obligation, so start with The Owner’s Shortlist and get a second read on the multiple before you sit down with a buyer.
Who wrote this: The Owner's Shortlist is not a broker and doesn't sell businesses. We get paid the same no matter which specialist we introduce you to. More about how we work.
Tell us your situation. We'll connect you with a specialist who works with owners like you. One conversation, no sales pressure.
Found this useful?
Add The Owner's Shortlist as a preferred source and get our articles highlighted in Google Search results.
Add to Preferred SourcesMost owner-run landscaping businesses sell for about 2 to 3 times what the owner earns. Here's what moves that number up or down, with real sale data.
November 15, 2026
Plan to sell my roofing business with a clear timeline, valuation drivers, broker options, and tax checks before you talk to any buyer.
October 31, 2026
How to sell a pest control business: normalize earnings, prove recurring routes, pick one broker, and negotiate financing, earnouts, and a quiet close.
October 30, 2026
Your electrical business is worth a multiple of its earnings, set by your crew, your license, and how much repeat work you have. Here's how buyers judge it.
October 29, 2026