How to Sell My Security Company: Steps, Value and Timeline
Thinking about how to sell my security company? Get a plain-language roadmap for valuation, broker vetting, confidentiality, deal structures and timing.
November 2, 2026
By Remi Taffin · November 4, 2026

You’ve run the shop for years, you know what it bills, and maybe a buyer, a broker, or a competitor has just tossed out a number that sounds high, low, or just made up. You’re left wondering what that figure rests on, and whether you could defend a different one. That’s where a selling a business valuation starts, not with revenue, but with the earnings a buyer can keep after you leave.
Say two plumbing companies each bill $3 million a year. One keeps more profit because the owner estimates every big job, sells the work, and holds the license. The other keeps less on paper, but a service manager runs estimates and sales while the owner mostly reviews reports. A buyer won’t value them the same, even though revenue matches.
An asking price is what you hope to get. A valuation is a supported estimate of what a buyer would pay when neither side is forced to act.
Fair market value is the price at which property would change hands between a willing buyer and willing seller, with neither party under compulsion and both having reasonable knowledge of the relevant facts.
That definition comes from Revenue Ruling 59-60, issued by the U.S. Internal Revenue Service in 1959 for closely held companies with no public market price. The ruling doesn’t endorse one formula. It asks the analyst to weigh the company’s nature and history, economic and industry conditions, earning capacity, dividend paying capacity, goodwill, asset value, and comparable companies, using common sense and informed judgment.
Revenue alone can’t answer any of those questions. It tells a buyer how much work came in, not how much cash stayed, who produced it, or whether it’ll repeat next year. That’s why preparing financials for a business valuation matters before you debate a multiple, because clean records let a buyer test each support instead of guessing.
The number is only as good as its assumptions. Your job isn’t to memorize a formula. It’s to understand which earnings figure was used, what risks were priced in, and what evidence backs the result before anyone makes an offer.
Buyers and brokers use several methods because each one measures something different. The same company can produce several defensible numbers, and confusion starts when someone compares them as if they meant the same thing.
| Method | What It Measures | Best Fit | Main Weakness |
|---|---|---|---|
| SDE (seller’s discretionary earnings) | Total economic benefit to one owner-operator, including owner pay | Owner-run businesses where the owner does the key work | Overstates value if a buyer must hire a manager |
| EBITDA | Operating profit before interest, taxes, depreciation and amortization, with a market salary for management | Businesses with a management team already in place | Depends on clean accounts and correctly normalized owner pay |
| Asset-based | Adjusted value of equipment, vehicles, inventory and receivables minus liabilities | Asset-heavy firms or weak earnings | Ignores goodwill, customer relationships and recurring revenue |
| Market comparables | Multiples paid in recent sales of similar businesses | Owners with reliable sales data in their niche | Few private-company comparables; data gaps and differing deal terms |
SDE answers a personal question, what total benefit does one working owner get from this business? That includes salary, benefits, and legitimate discretionary items. It’s useful when the buyer plans to step into your job. It misleads when the buyer won’t, because nobody has deducted the manager who’ll replace you.
EBITDA answers an operating question. It strips out financing and tax choices so buyers can compare operations, but it still assumes management gets paid a market salary. A larger HVAC or electrical company with a general manager in place fits this view better than a three truck shop run from the owner’s phone.
Asset-based value is a floor in many service deals, not a ceiling. Trucks, excavators, lifts, parts inventory, and receivables have resale value, minus what you owe. If earnings are weak, a buyer may pay mainly for those assets. If you have signed maintenance contracts and loyal customers, this method leaves that goodwill out entirely.
Market comparables borrow strength from real deals, but private sales data is thin and terms differ. Timing matters too. According to Prairie Capital, deal valuation multiples for transactions below $25 million were 6.7x in the first quarter of 2025, compared with a long-run average of 6.2x. Treat that as a signal that the broad market moves over time, not as a price for a small owner-operated service business. It covers a wide band of deals on a different basis than SDE, so don’t set it beside an SDE range and expect them to match.
A broker usually leads with the method that matches who’ll run the business after closing. A buyer often tests a second method anyway, for example checking an SDE price against asset value, to see how much of the offer pays for earnings rather than equipment.
Reported profit rarely equals the earnings a buyer will acquire. Your tax return was built to lower taxes legally, not to show transferable cash flow. Normalizing means adjusting profit so it reflects how the business would perform under a new owner, in a normal year.
That last step is where many owners get surprised. Removing expenses can raise reported cash flow and still fail to raise value if the buyer must replace you at comparable cost. A personal truck add-back helps. Adding back your full salary while ignoring the estimator, salesperson, and licensed qualifier you also are, doesn’t.
The distinction shows up in deal results. In the Calder Capital Q3 2025 market update, in deals valued at $1 million to $5 million, the average EBITDA multiple was 4.11x while the average SDE multiple was 3.44x, with the gap attributed partly to heavier owner involvement, discretionary expenses, and normalization adjustments.
First, show earnings if you stayed and kept running things as you do now. That’s familiar, but it isn’t what a departing owner sells.
Second, show earnings with a hired manager running daily operations. Deduct that salary, payroll taxes, and any added supervision cost. This scenario suits buyers who’ll own the company but won’t estimate jobs or ride along on service calls.
Third, show earnings if the business can operate independently because a manager, documented procedures, and customer relationships already sit with the company. That version usually supports a stronger argument, provided you can prove it.
Ask the blunt question behind all three. If your salary, personal expenses, customer relationships, estimating, sales, and technical work disappeared tomorrow, what earnings would remain? Document every adjustment with a receipt, payroll record, lease, invoice, or short written explanation. Undocumented add-backs don’t build trust, they start an argument.
A hypothetical shows why arguments over half a turn of a multiple matter. Say your normalized SDE comes to $600,000. A 2.0x indication produces $1.2 million; a 3.0x indication produces $1.8 million. Revenue didn’t move between those two answers. The $600,000 gap comes entirely from how a buyer reads risk and transferability, which is why the metric and the multiple have to be argued together.
The visual below sets the two metrics side by side so you can see which buyer each one describes.
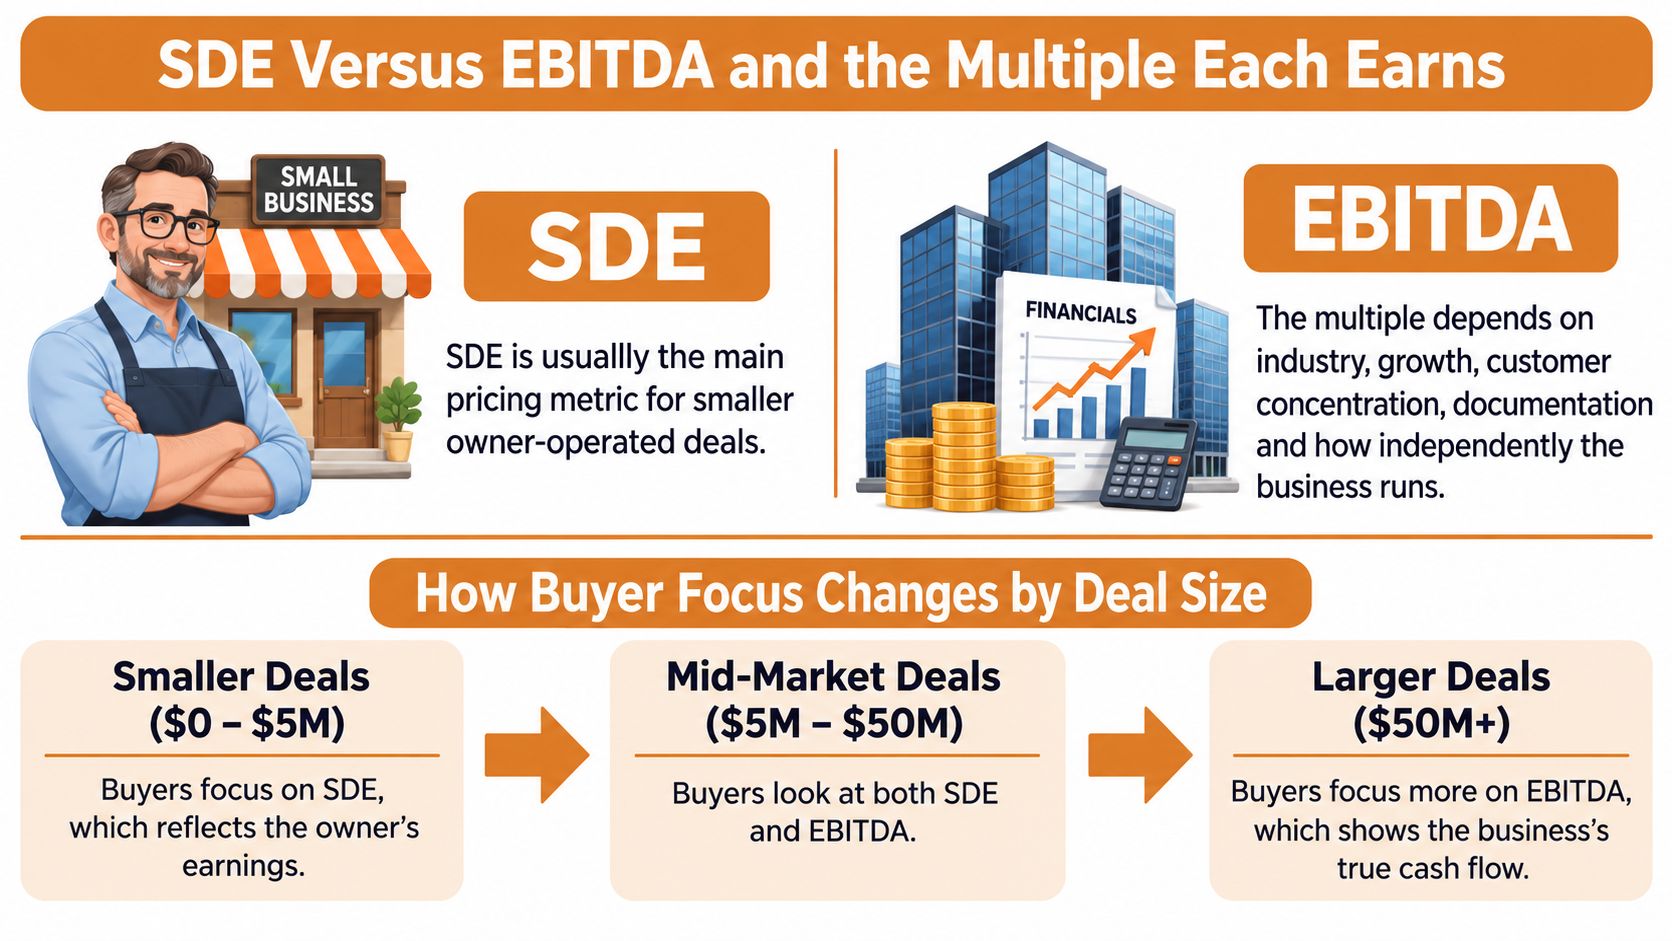
For smaller owner-operated acquisitions, Seller’s Discretionary Earnings is often the principal pricing metric. It generally starts with net profit and adds back owner salary and benefits, interest, depreciation, amortization, and legitimate one-time expenses. EBITDA differs on one line: it deducts a market-level replacement manager before earnings are counted. That difference decides which earnings the buyer keeps after closing. Mixing the two metrics inflates value fast, because you’d be applying a managed-business multiple to earnings that haven’t paid for management.
| Metric and Deal Type | Typical Multiple | Note |
|---|---|---|
| SDE, deals of $1M to $5M (2025 average) | 3.44x | Heavier owner involvement and normalization adjustments |
| EBITDA, deals of $1M to $5M (2025 average) | 4.11x | Buyer must pay for management after closing |
Read those two rows carefully. The EBITDA figure looks higher because its earnings base is smaller once management pay comes out. A higher multiple on a smaller number doesn’t automatically produce a higher price. Owners who quote only the bigger multiple, without naming the metric behind it, end up negotiating against themselves.
Outside those mid-market averages, there is no single SDE range you can quote with confidence. As a general pattern, SDE multiples sit toward the low end when the owner still does the estimating, the selling, and the technical work, and they strengthen as those duties move into documented roles a buyer can step around. The spread between a thin file and a well-documented one is wide, which is exactly why the example above applies two different multiples to identical earnings.
This short video gives you another way to hear the distinction before you apply it to your own statements.
What pushes an SDE indication higher is evidence a buyer can verify. Recurring service contracts, clean monthly statements, job-level gross margin reporting, documented technician procedures, a capable service manager, and a customer database showing retention and concentration all reduce a buyer’s guesswork about which earnings survive the handover.
Present the metric that matches who will run the business after closing.
If the buyer will work in the business, lead with SDE and show exactly what role they’re buying. If they’ll hire management, lead with EBITDA and price that manager accurately. Either figure is still an estimate, but the right pairing keeps the conversation grounded.
Your profit rose last year, so why didn’t your valuation rise by the same percentage? Because value has two moving parts, earnings and the multiple, and they don’t always move together. Buyers can believe your earnings and still pay less per dollar of them if market conditions, risk, or growth quality shifts.
Recent quarterly movement makes that plain. The Kreischer Miller review of private company valuation trends through Q4 2025 reports the median private-company EBITDA multiple moved from 3.5x in Q4 2024 to 3.7x in Q1 2025, 3.8x in Q2, 3.7x in Q3, and back to 3.5x in Q4. Revenue multiples in that same review moved from 0.60x in Q1 to 0.53x in Q3 before rebounding to 0.62x in Q4, and the Lincoln Private Market Index reported a 2.3% increase in private-company enterprise value in Q1 2025 while multiple contraction offset some benefit from earnings growth.
That pattern is the contrarian lesson many owners miss. Maximizing the latest year’s profit isn’t always the same as maximizing enterprise value. Cutting a service manager, deferring truck maintenance, or skipping technician training can lift one year of earnings while raising the risk a buyer prices into the multiple.
Normalized earnings come first, but buyers look past size to durability. They ask whether margins hold after replacement labor, market rent, and normal equipment spending.
Growth quality comes next. Growth from signed maintenance renewals, repeat commercial accounts, and modest price increases reads differently from growth bought with deep discounts or one storm season. A roofing company that spiked after hurricane work has a harder story than a pest control firm adding routes steadily.
Risk covers customer concentration, owner dependence, licensing, labor supply, safety record, and how clean the books are. A buyer doesn’t need to dislike your business to discount it. They only need to see several ways earnings could fall after closing.
Market liquidity is the part you control least. When lenders tighten or fewer buyers compete, multiples can contract even for solid companies. When strategic buyers want your territory, the opposite can happen.
| Factor | Raises the Multiple | Lowers the Multiple |
|---|---|---|
| Recurring maintenance revenue | Signed service agreements renewing each year | Mostly one-time jobs and bidding |
| Customer concentration | Revenue spread across many customers | A few customers supply most sales |
| Owner dependence | Manager runs estimating and sales | Owner holds the licenses and client relationships |
| Financial records | Monthly statements and job-level margins | Cash-basis books with personal spending mixed in |
| Labor availability | Stable, licensed technicians with low turnover | Constant hiring or reliance on one licensed technician |
| Growth quality | Growth from pricing and repeat customers | Growth from one-time spikes or deep discounts |
| Management transition | Written procedures and a trained successor | No plan for who runs operations after closing |
Use that checklist carefully. If three rows land in the right column, arguing for the top of a published range will be uphill until you fix or explain them. Our guide to the best value drivers can help you sort which gaps deserve attention first, especially when time before a sale is limited.
A broker’s estimate usually starts with comparable sales. They look for businesses of similar size, trade, geography, and owner involvement, then adjust for your strengths and weaknesses. A defensible range should state the date of those transactions, deal size, buyer type, metric used, and assumptions required to reach the range. If someone won’t show that work, treat the number as an opinion in search of support.
A buyer’s offer starts with what they expect to keep. They model earnings after closing, subtract debt service, capital spending for trucks and equipment, taxes, and the management they’ll need. Then they decide what return justifies the risk. Two buyers can run that math and land far apart without either one acting in bad faith.
Buyer type explains much of the spread. A strategic buyer, perhaps a regional HVAC platform or landscaping company, may pay for route density, geographic fit, a licensed team, or cross selling to their existing customers. A financial buyer without those synergies pays from standalone cash flow, so owner dependence and thin management hurt more. An individual buyer using a loan has another constraint, the business must service debt and still pay them a living.
A headline price is not the same as cash at closing.
An offer of $1.8 million might sound identical from two buyers until you read the terms. One may pay most of it at closing. The other may include an earnout tied to retained revenue, seller financing paid over time, or a holdback released after warranties or customer retention targets are met. Those structures shift risk back to you, so compare offers by timing and certainty, not headline alone.
Before you react to any price, ask three questions.
Those answers turn a flattering or disappointing number into something you can evaluate.
Preparation works backward from the sale you want, because buyers trust patterns more than a single strong year. Two years gives you time to clean the earnings story and prove the business can run with less of you in the middle.
This timeline shows the early preparation steps in sequence.
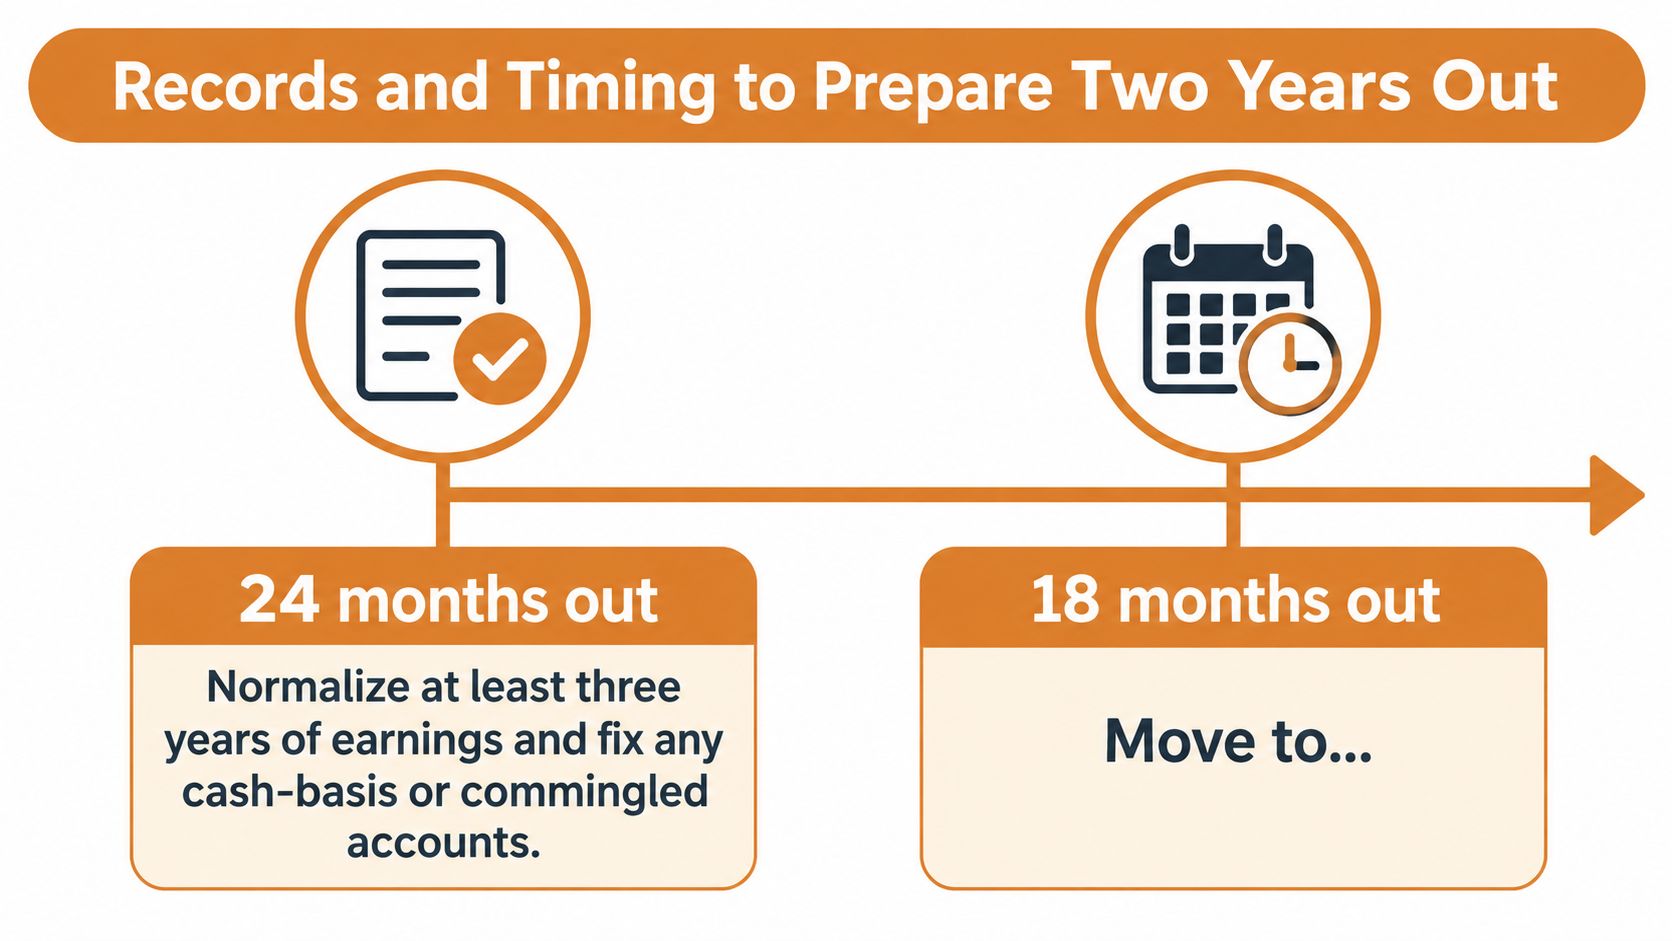
About 24 months out, normalize at least three years of earnings and fix cash basis or commingled accounts. Separate personal spending, and stop running new personal items through the company. If you can’t explain an expense quickly, a buyer’s accountant won’t accept it.
About 18 months out, move to monthly financial statements with job level margins. Gather customer revenue and tenure so you can show concentration and retention instead of asserting loyalty. This is also when documentation for add-backs should become a folder, not a memory.
About 12 months out, begin shifting estimating, sales, dispatch decisions, or licensed supervision to someone else. Write down procedures for scheduling, pricing, callbacks, collections, and safety checks. Even partial transfer helps, because a buyer can see a path instead of a cliff.
About six months out, engage a tax adviser and attorney and get an initial valuation range. Ask what a buyer will test in diligence, including whether a deeper earnings review makes sense. Our explainer on what is a quality of earnings report outlines how that kind of review examines whether reported earnings hold up.
These are general preparation steps, not tax or legal advice. Bring entity, licensing, and transaction tax questions to qualified advisers early, while you still have choices.
Don’t start by picking a broker. Start by finishing enough of the numbers to know what conversation you’re having.
A broker or valuation specialist helps when you need a second opinion on earnings, a credible comparable set, buyer screening, or help reviewing deal terms. If a buyer later prepares formal sale materials, a fundraising document explained for founders can clarify what an offering memorandum is, though your adviser should confirm what your deal requires. For timing the first conversation, see when to talk to a business broker.
We should be clear about our role. The Owner’s Shortlist is not a broker and does not sell businesses. Owners tell us their situation, and we connect them with the right specialist in one conversation. That first conversation comes with no sales pressure.
This article is general information, not legal, tax, or financial advice. Every figure discussed here is an estimate that depends on assumptions a qualified adviser should confirm for your business.
Do one concrete thing this week. Write down your normalized SDE, your EBITDA, and your three weakest value drivers on one page, and bring that page to any conversation about selling a business valuation.
Bring that one page to The Owner’s Shortlist, tell a real person what your normalized earnings look like and where owner dependence still sits, and we’ll connect you with one specialist whose past work fits a business like yours, with no cost, no obligation, and no sales pressure.
Who wrote this: The Owner's Shortlist is not a broker and doesn't sell businesses. We get paid the same no matter which specialist we introduce you to. More about how we work.
Tell us your situation. We'll connect you with a specialist who works with owners like you. One conversation, no sales pressure.
Found this useful?
Add The Owner's Shortlist as a preferred source and get our articles highlighted in Google Search results.
Add to Preferred SourcesThinking about how to sell my security company? Get a plain-language roadmap for valuation, broker vetting, confidentiality, deal structures and timing.
November 2, 2026
Your Florida pest control license and operator certificate don't transfer to a buyer. Here's how sales handle it, what buyers check, and what to do first.
October 30, 2026
Don't say yes, don't say no, and don't sign anything. Find out what the offer really pays, get a second opinion, then respond. Here's the order to do it in.
October 29, 2026
Most small trucking companies sell for about 3 times owner earnings. Here's how buyers price your trucks, your authority, and your customers, and how to start.
October 29, 2026